Fig. 11.
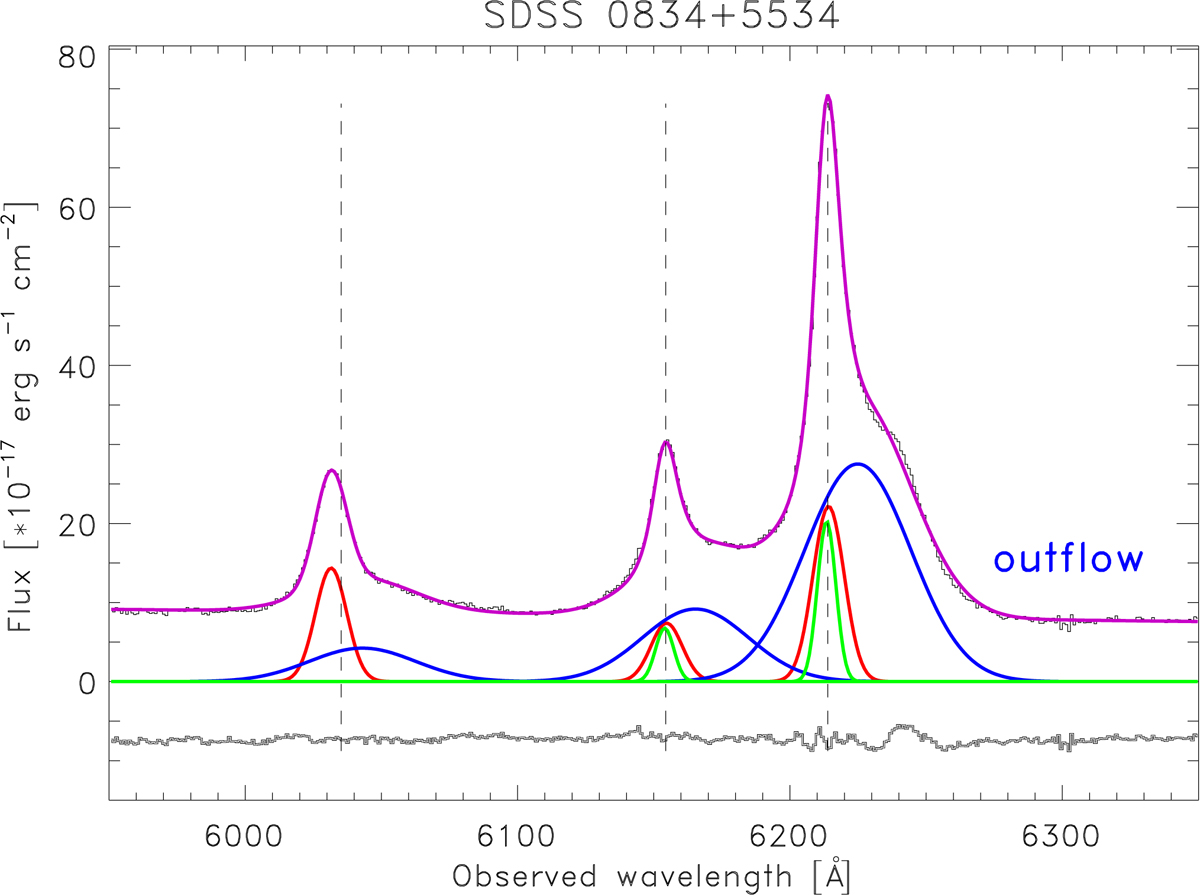
Hβ–[OIII] observed spectrum of SDSS 0834+5534 where the main (systemic) and broad (outflow) components coexist. The purple curve shows the total Hβ–[OIII] components obtained from multicomponent Gaussian fits. The red and blue curves represent the systemic and broad components, respectively. In green we show the third narrow component (see text for details).
Current usage metrics show cumulative count of Article Views (full-text article views including HTML views, PDF and ePub downloads, according to the available data) and Abstracts Views on Vision4Press platform.
Data correspond to usage on the plateform after 2015. The current usage metrics is available 48-96 hours after online publication and is updated daily on week days.
Initial download of the metrics may take a while.