Free Access
Fig. 8.
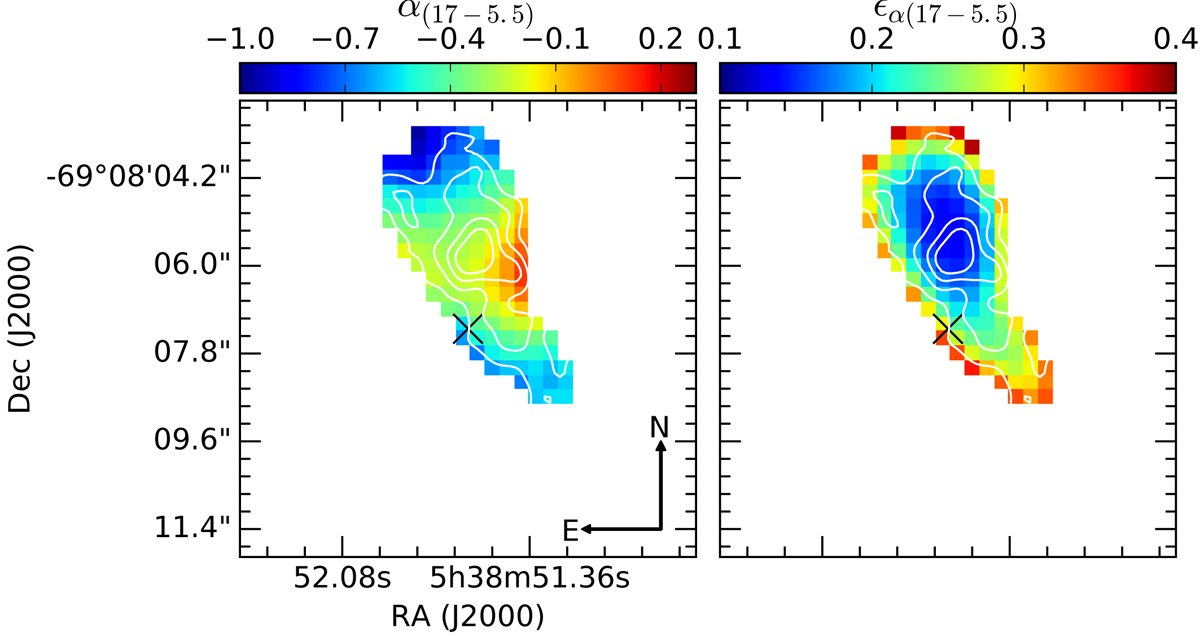
Left: spectral index map between 17 and 5.5 GHz. Right: error spectral index map in Jy pixel−1. The map at 17 GHz was reconvolved in order to match the beam at 5.5 GHz. The white contours indicate flux densities above 3, 5, 7, 9 σ of the 17 GHz emission. The cross indicates the position of the star.
Current usage metrics show cumulative count of Article Views (full-text article views including HTML views, PDF and ePub downloads, according to the available data) and Abstracts Views on Vision4Press platform.
Data correspond to usage on the plateform after 2015. The current usage metrics is available 48-96 hours after online publication and is updated daily on week days.
Initial download of the metrics may take a while.