Fig. 4.
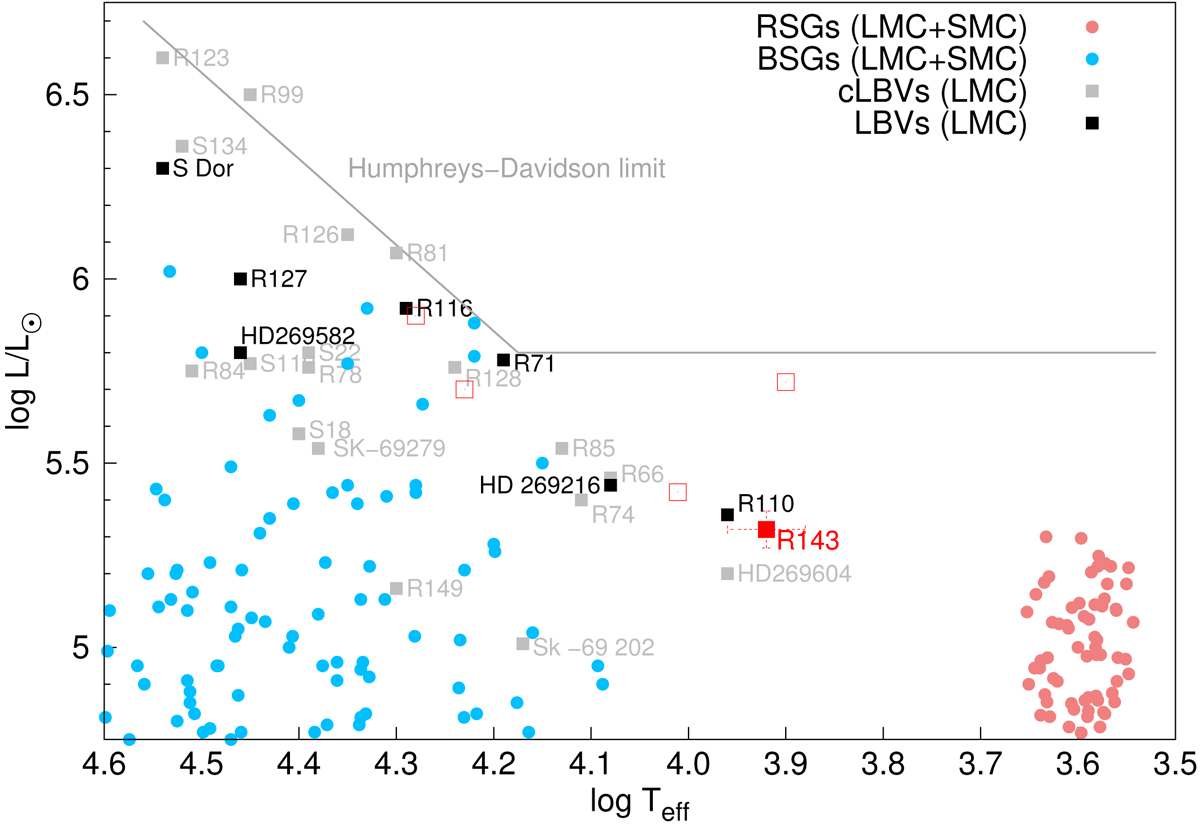
Schematic upper HR diagram of the LMC, adapted from Mehner et al. (2017). Confirmed LBVs (black) and candidate LBVs (grey) are shown at their minimum phases. Blue and red supergiants are indicated with blue and red filled circles. We show the location of RMC 143 obtained in this work (filled red square). Previous literature values for RMC 143 are also shown (open red squares).
Current usage metrics show cumulative count of Article Views (full-text article views including HTML views, PDF and ePub downloads, according to the available data) and Abstracts Views on Vision4Press platform.
Data correspond to usage on the plateform after 2015. The current usage metrics is available 48-96 hours after online publication and is updated daily on week days.
Initial download of the metrics may take a while.