Fig. 2.
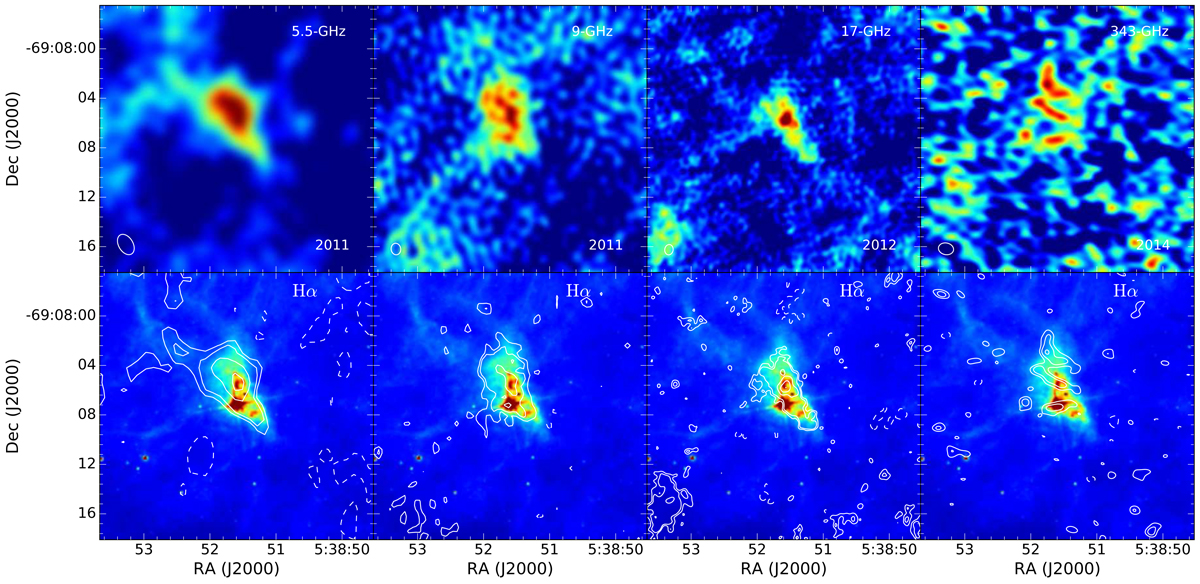
From top-left to top-right: ATCA 5.5, 9 and 17 GHz, ALMA 343 GHz maps, showing the same field of view. The synthesized beam is indicated as a white ellipse. From bottom-left to bottom-right: radio and sub-mm contours superimposed on the HST Hα image (Weis 2003). The lowest contour level is 2σ, followed by 3σ and then increases in steps of three (steps of two at 9 GHz). In the case of the 343 GHz map, the 2, 3 and 4σ levels are shown. All the panels are centred on the stellar position, which is the brightest source in the Hα image.
Current usage metrics show cumulative count of Article Views (full-text article views including HTML views, PDF and ePub downloads, according to the available data) and Abstracts Views on Vision4Press platform.
Data correspond to usage on the plateform after 2015. The current usage metrics is available 48-96 hours after online publication and is updated daily on week days.
Initial download of the metrics may take a while.