Fig. 10.
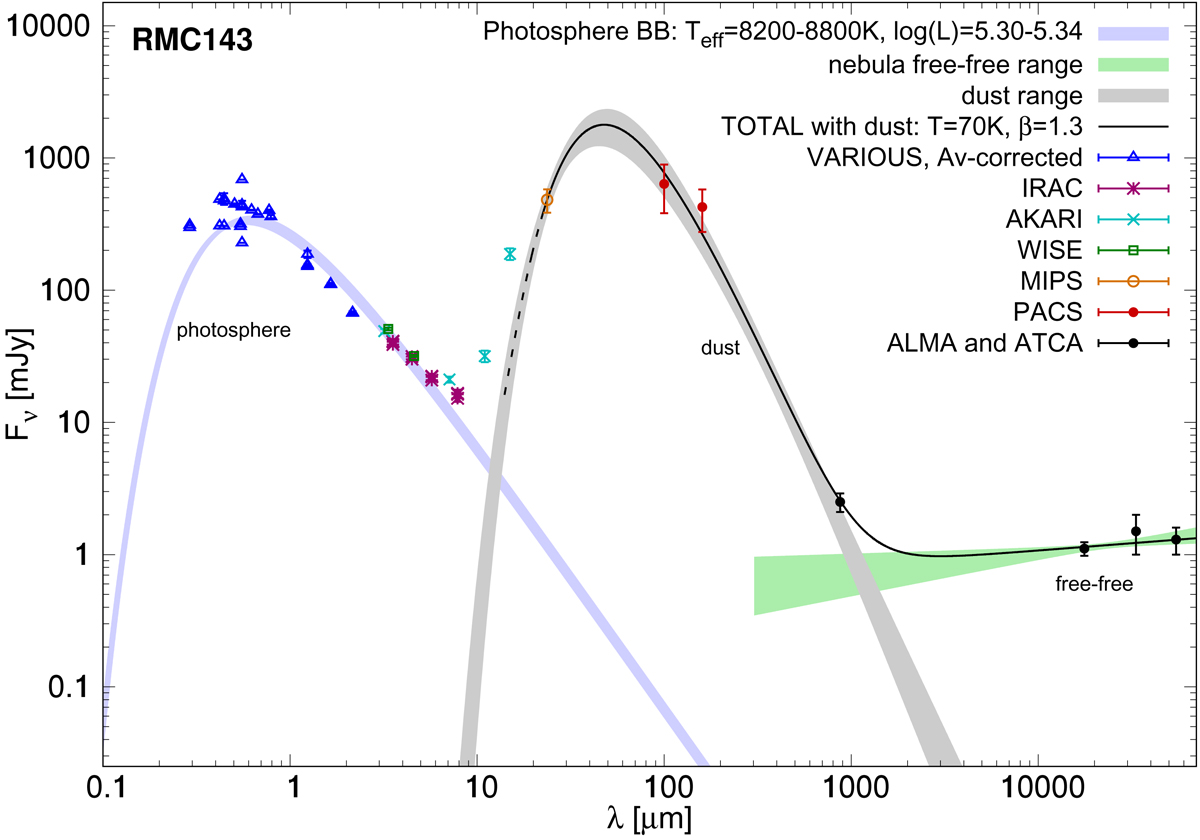
Flux density distribution of RMC 143 from IR catalogues and our ALMA and ATCA measurements. The dust component shown is a greybody fit to the MIPS24, PACS100, PACS160, and ALMA photometry. The grey and green bands show the ranges of values within twice the minimum χ2 for the dust greybody and nebula free-free fits, respectively. We note that the AKARI S11 and L15 photometry have a colour correction applied assuming a T = 70 K, β = 1 greybody.
Current usage metrics show cumulative count of Article Views (full-text article views including HTML views, PDF and ePub downloads, according to the available data) and Abstracts Views on Vision4Press platform.
Data correspond to usage on the plateform after 2015. The current usage metrics is available 48-96 hours after online publication and is updated daily on week days.
Initial download of the metrics may take a while.