Free Access
Fig. 9.
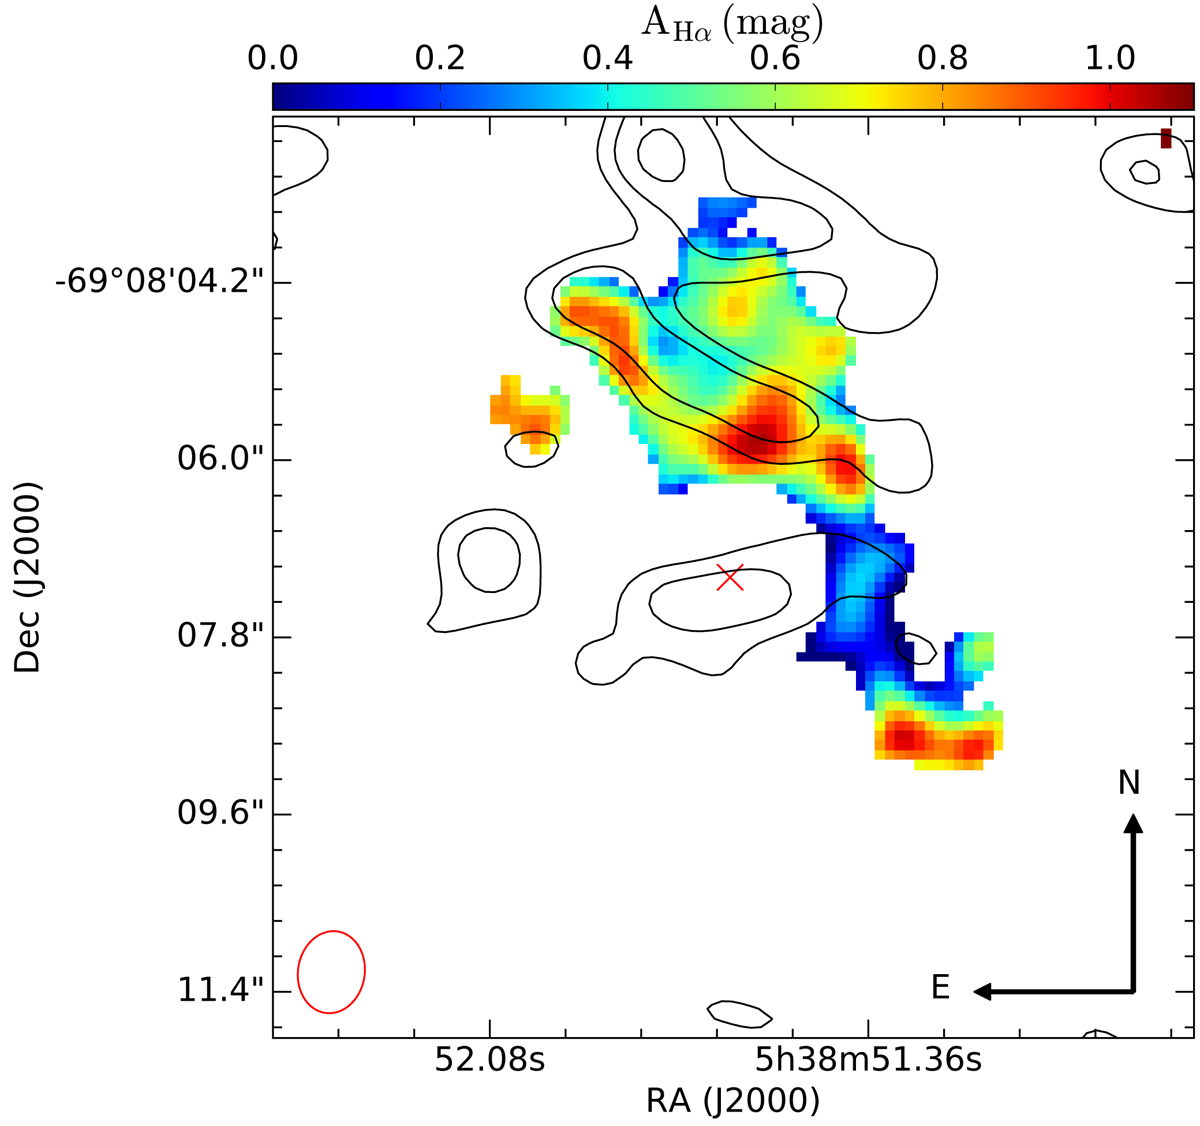
Extinction map in Hα derived by comparing the Hα recombination line and the centimetre (17 GHz) emission above 3σ. The central star, indicated with the red cross, is masked with a circular aperture in the optical image. The sub-mm contours at 343 GHz are shown (black lines).
Current usage metrics show cumulative count of Article Views (full-text article views including HTML views, PDF and ePub downloads, according to the available data) and Abstracts Views on Vision4Press platform.
Data correspond to usage on the plateform after 2015. The current usage metrics is available 48-96 hours after online publication and is updated daily on week days.
Initial download of the metrics may take a while.