Free Access
Fig. 9.
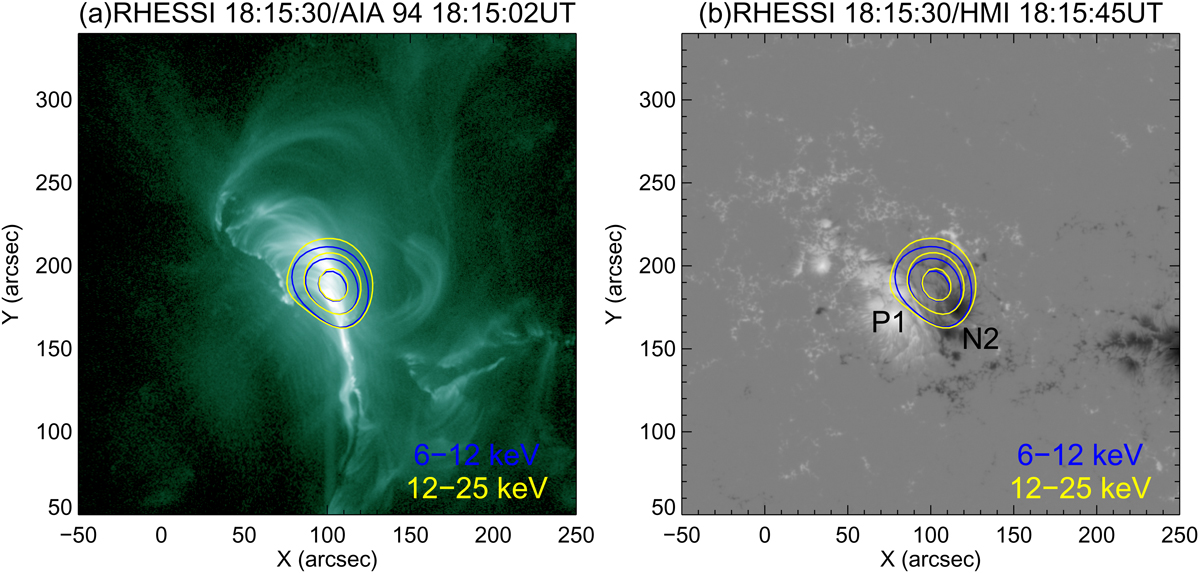
RHESSI images at 6−12 keV (blue) and 12−25 keV (yellow) energy range using the CLEAN reconstruction algorithm overlaid on AIA 94 Å and HMI images near the peak phase of the flare (integrated for 30 s). The contour levels are 50, 70 and 90% of the peak intensity.
Current usage metrics show cumulative count of Article Views (full-text article views including HTML views, PDF and ePub downloads, according to the available data) and Abstracts Views on Vision4Press platform.
Data correspond to usage on the plateform after 2015. The current usage metrics is available 48-96 hours after online publication and is updated daily on week days.
Initial download of the metrics may take a while.