Free Access
Fig. 6.
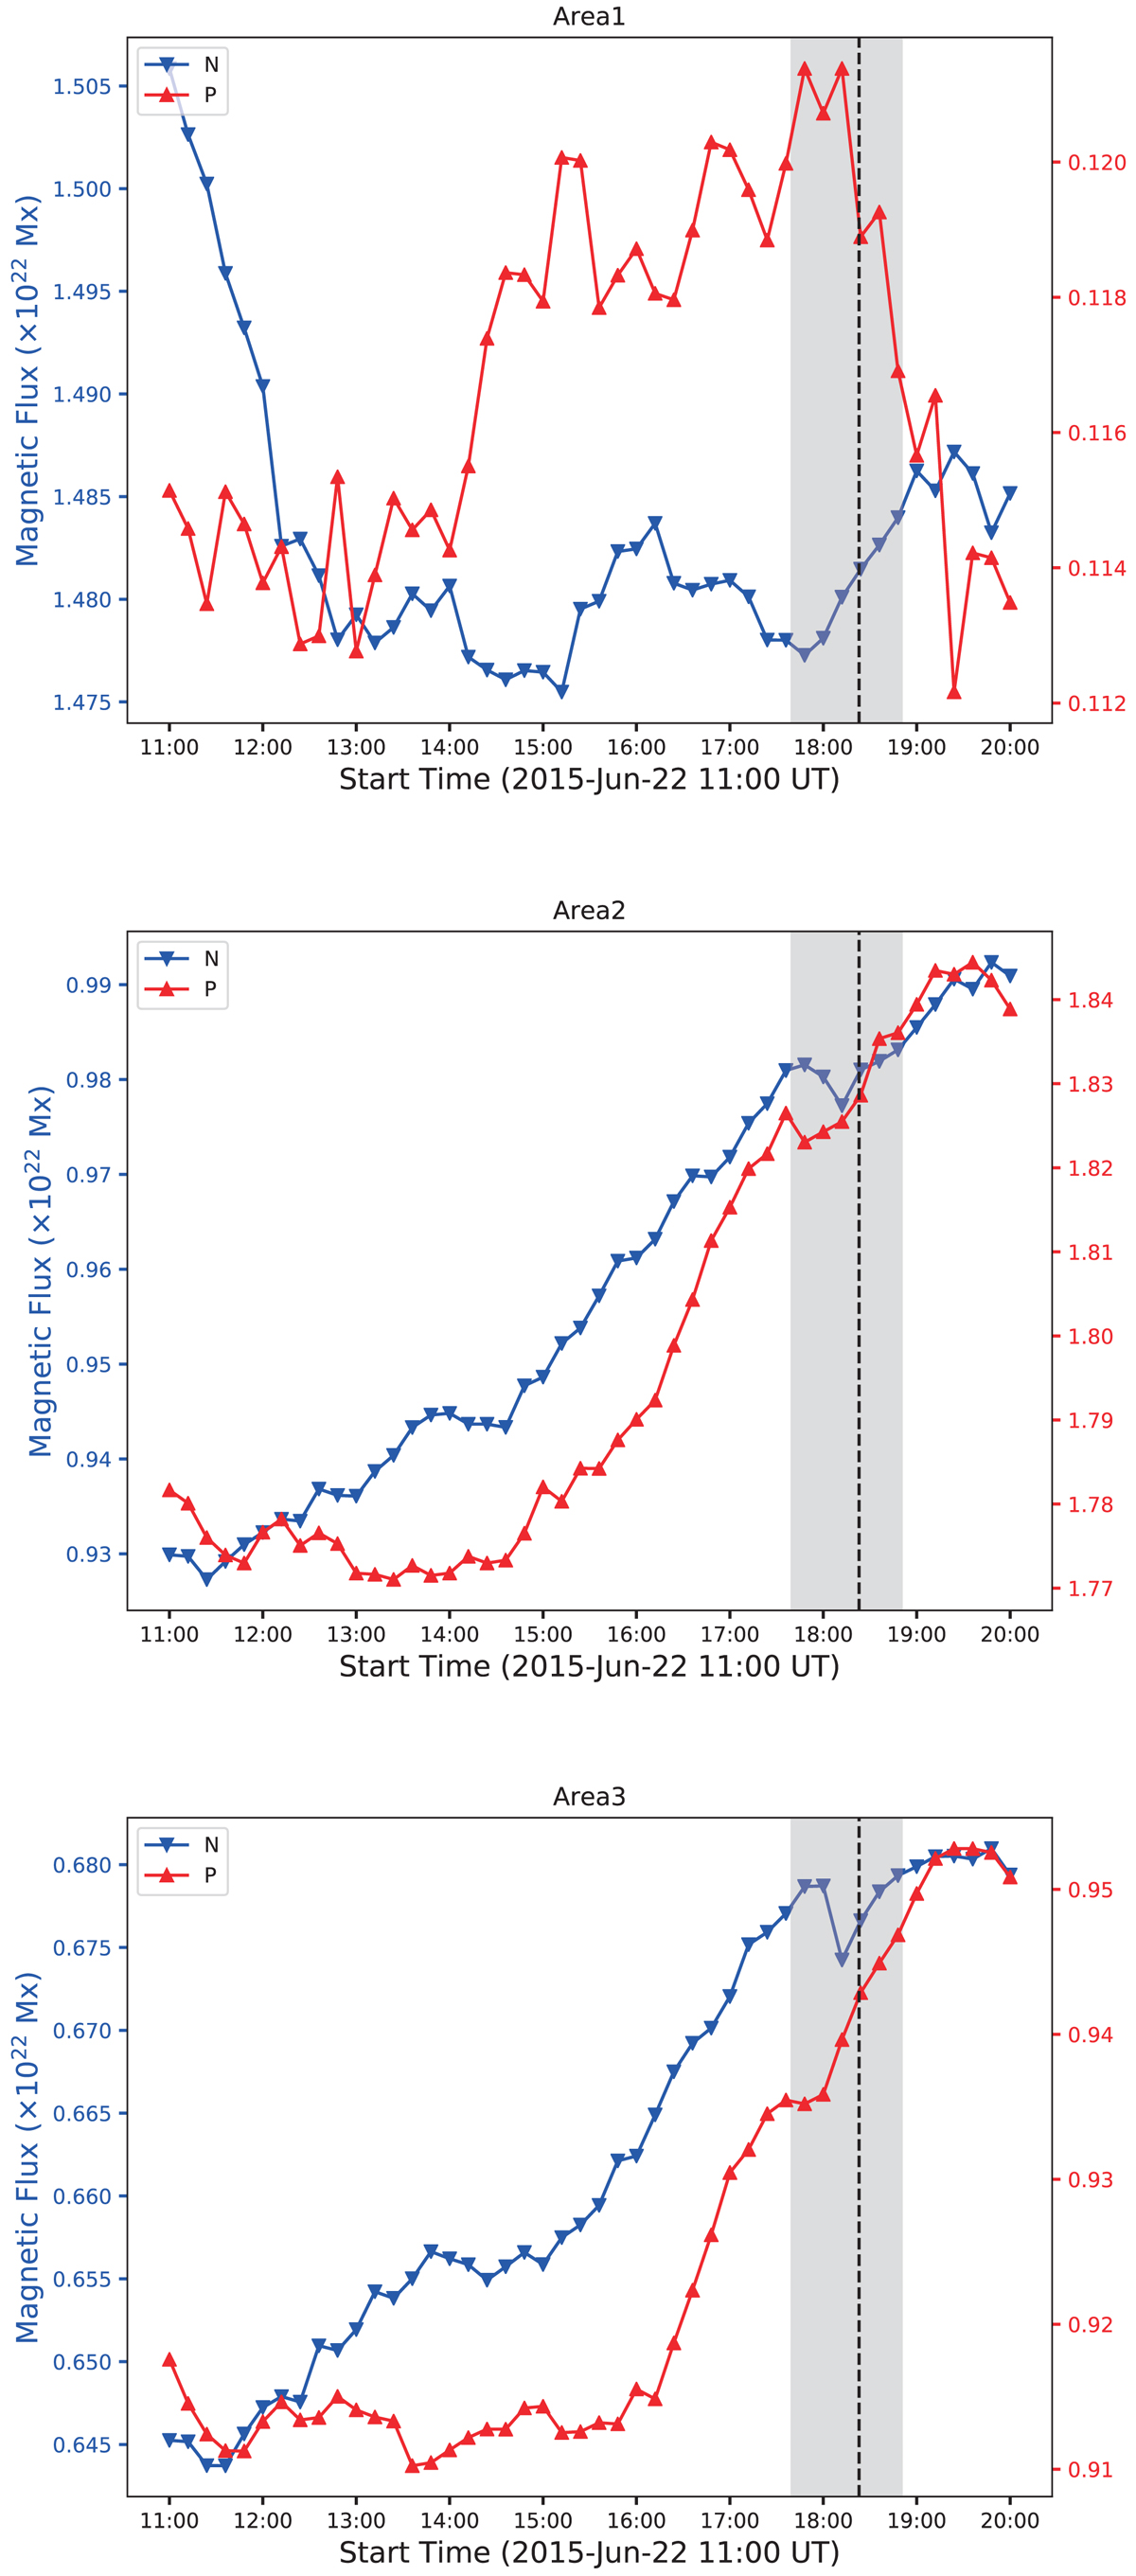
Positive (red) and negative (blue) magnetic flux evolution in different areas of active region 12371. The vertical black dashed line represents the flare peak time at 18:23 UT, and the gray bar represents the flare span time from 17:39 UT to 18:51 UT.
Current usage metrics show cumulative count of Article Views (full-text article views including HTML views, PDF and ePub downloads, according to the available data) and Abstracts Views on Vision4Press platform.
Data correspond to usage on the plateform after 2015. The current usage metrics is available 48-96 hours after online publication and is updated daily on week days.
Initial download of the metrics may take a while.