Fig. 15.
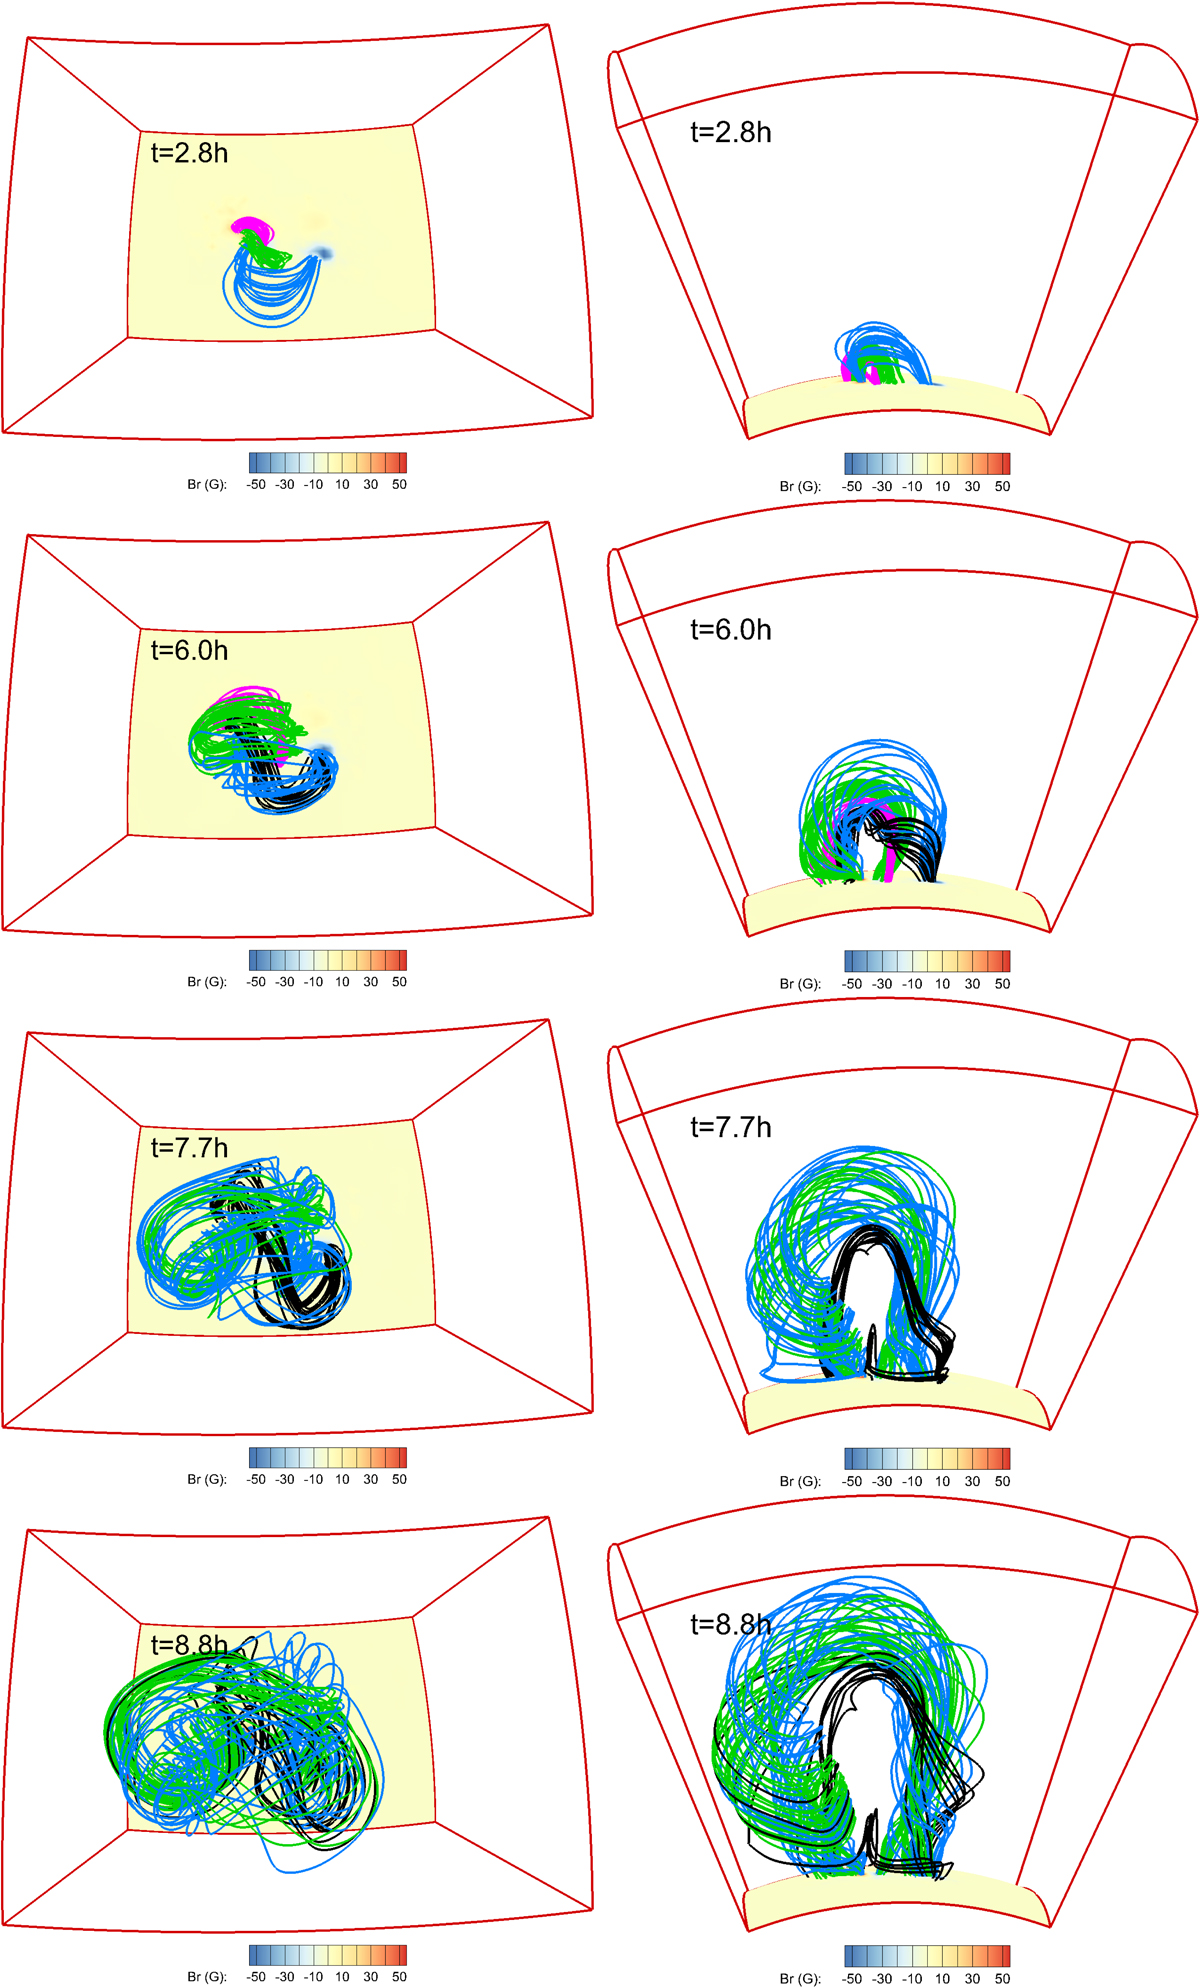
Snapshots of three dimensional magnetic field lines of AR 12371 at different times. Different flux systems are shown with different colors. Left column: magnetic field lines viewed from the top. Right column: magnetic field lines viewed from the side. The bottom boundary is colored with radial magnetic field. The domain is outlined by the red curves.
Current usage metrics show cumulative count of Article Views (full-text article views including HTML views, PDF and ePub downloads, according to the available data) and Abstracts Views on Vision4Press platform.
Data correspond to usage on the plateform after 2015. The current usage metrics is available 48-96 hours after online publication and is updated daily on week days.
Initial download of the metrics may take a while.