Fig. 8.
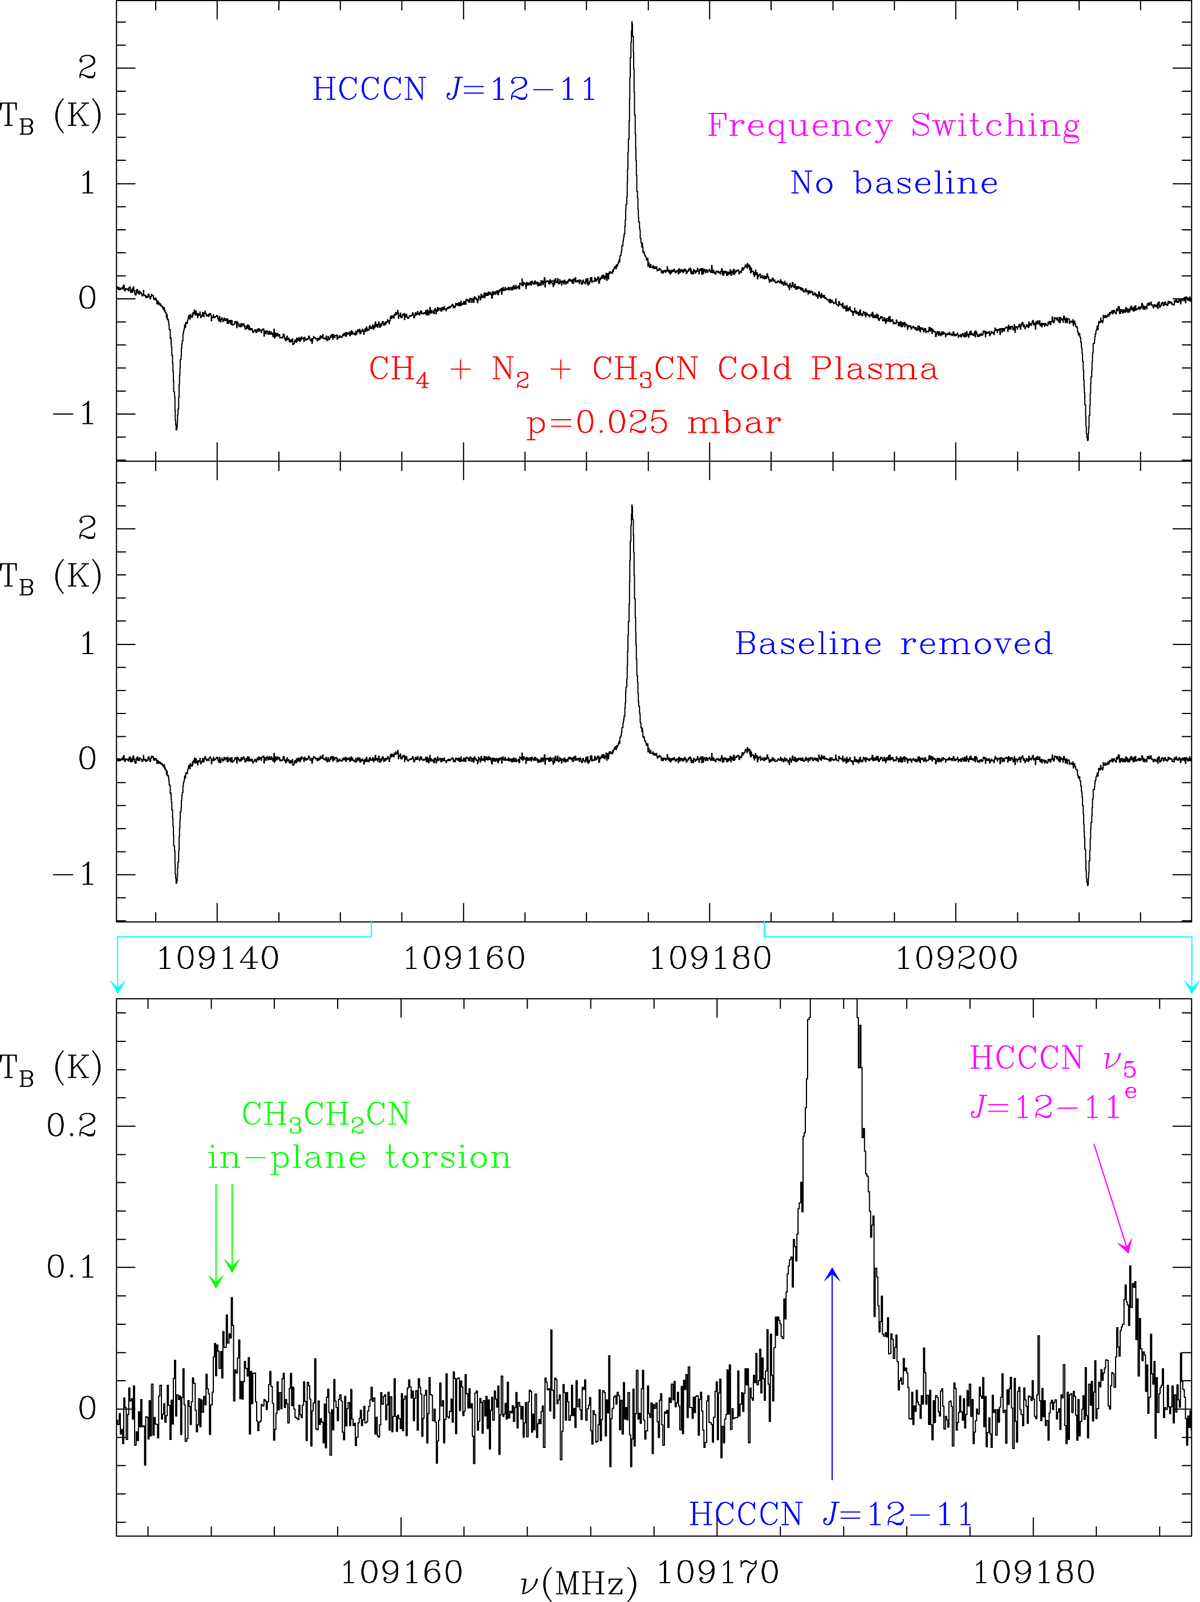
Cold plasma of CH4, N2, and CH3CN observed in frequency switching mode with a frequency throw of 37 MHz. The data have been folded. Upper panel: observed spectrum around HC3N J = 12 → 11 (produced in the plasma) without removing the baseline. Middle panel: resulting spectrum when a polynomial baseline is removed. The bottom spectrum is magnified in frequency and intensity to show the weak lines that were detected from HC3N ν5 (Eup ≃ 1000 K) and the in-plane torsion of CH3CH2CN (produced in the plasma, Eup ≃ 320 K). The integration time for this observation is 100 s.
Current usage metrics show cumulative count of Article Views (full-text article views including HTML views, PDF and ePub downloads, according to the available data) and Abstracts Views on Vision4Press platform.
Data correspond to usage on the plateform after 2015. The current usage metrics is available 48-96 hours after online publication and is updated daily on week days.
Initial download of the metrics may take a while.