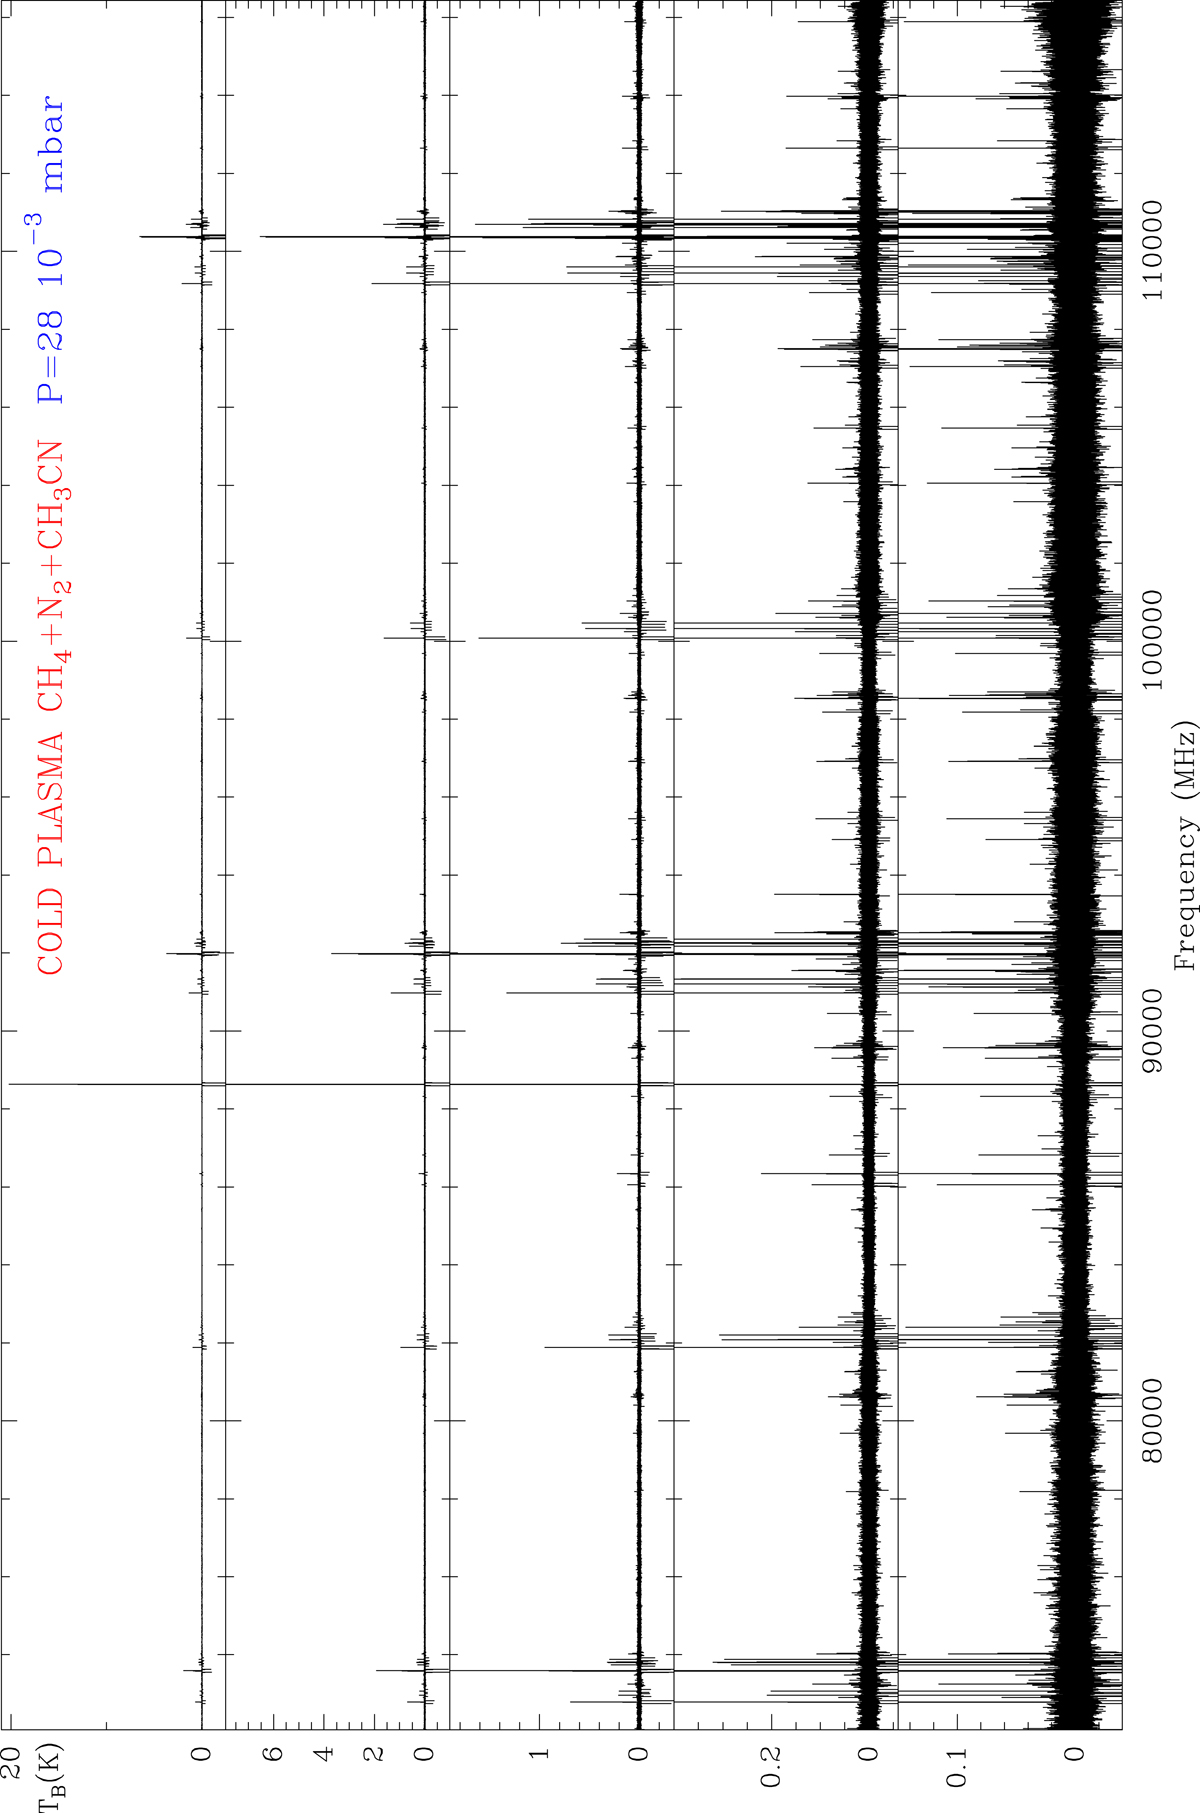
Fig. C.5.

W-band spectrum of a CH4, N2, and CH3CN plasma at a total pressure of 28 × 10−3 mbar. The RF power is 35 W. The observing time per W sub-band is 26 min. Only the CH3CN precursor shows rotational transitions, since N2 and CH4 have no permenent electric dipole moment. We note, however, the forest of lines appearing in this short integration time. The strong feature around 88 631 MHz corresponds to HCN. Other polar species produced in the plasma are HC3N, CH2CHCN, CH3CH2CN, and CN (this one is only observed in the optical spectrum). A zoom-in on the J = 1 → 0 line of HCN and its isotopologues is shown in Fig. 15. The frequency region around the J = 12 → 11 lines of HC3N is shown in Fig. C.6.
Current usage metrics show cumulative count of Article Views (full-text article views including HTML views, PDF and ePub downloads, according to the available data) and Abstracts Views on Vision4Press platform.
Data correspond to usage on the plateform after 2015. The current usage metrics is available 48-96 hours after online publication and is updated daily on week days.
Initial download of the metrics may take a while.


