Fig. C.4.
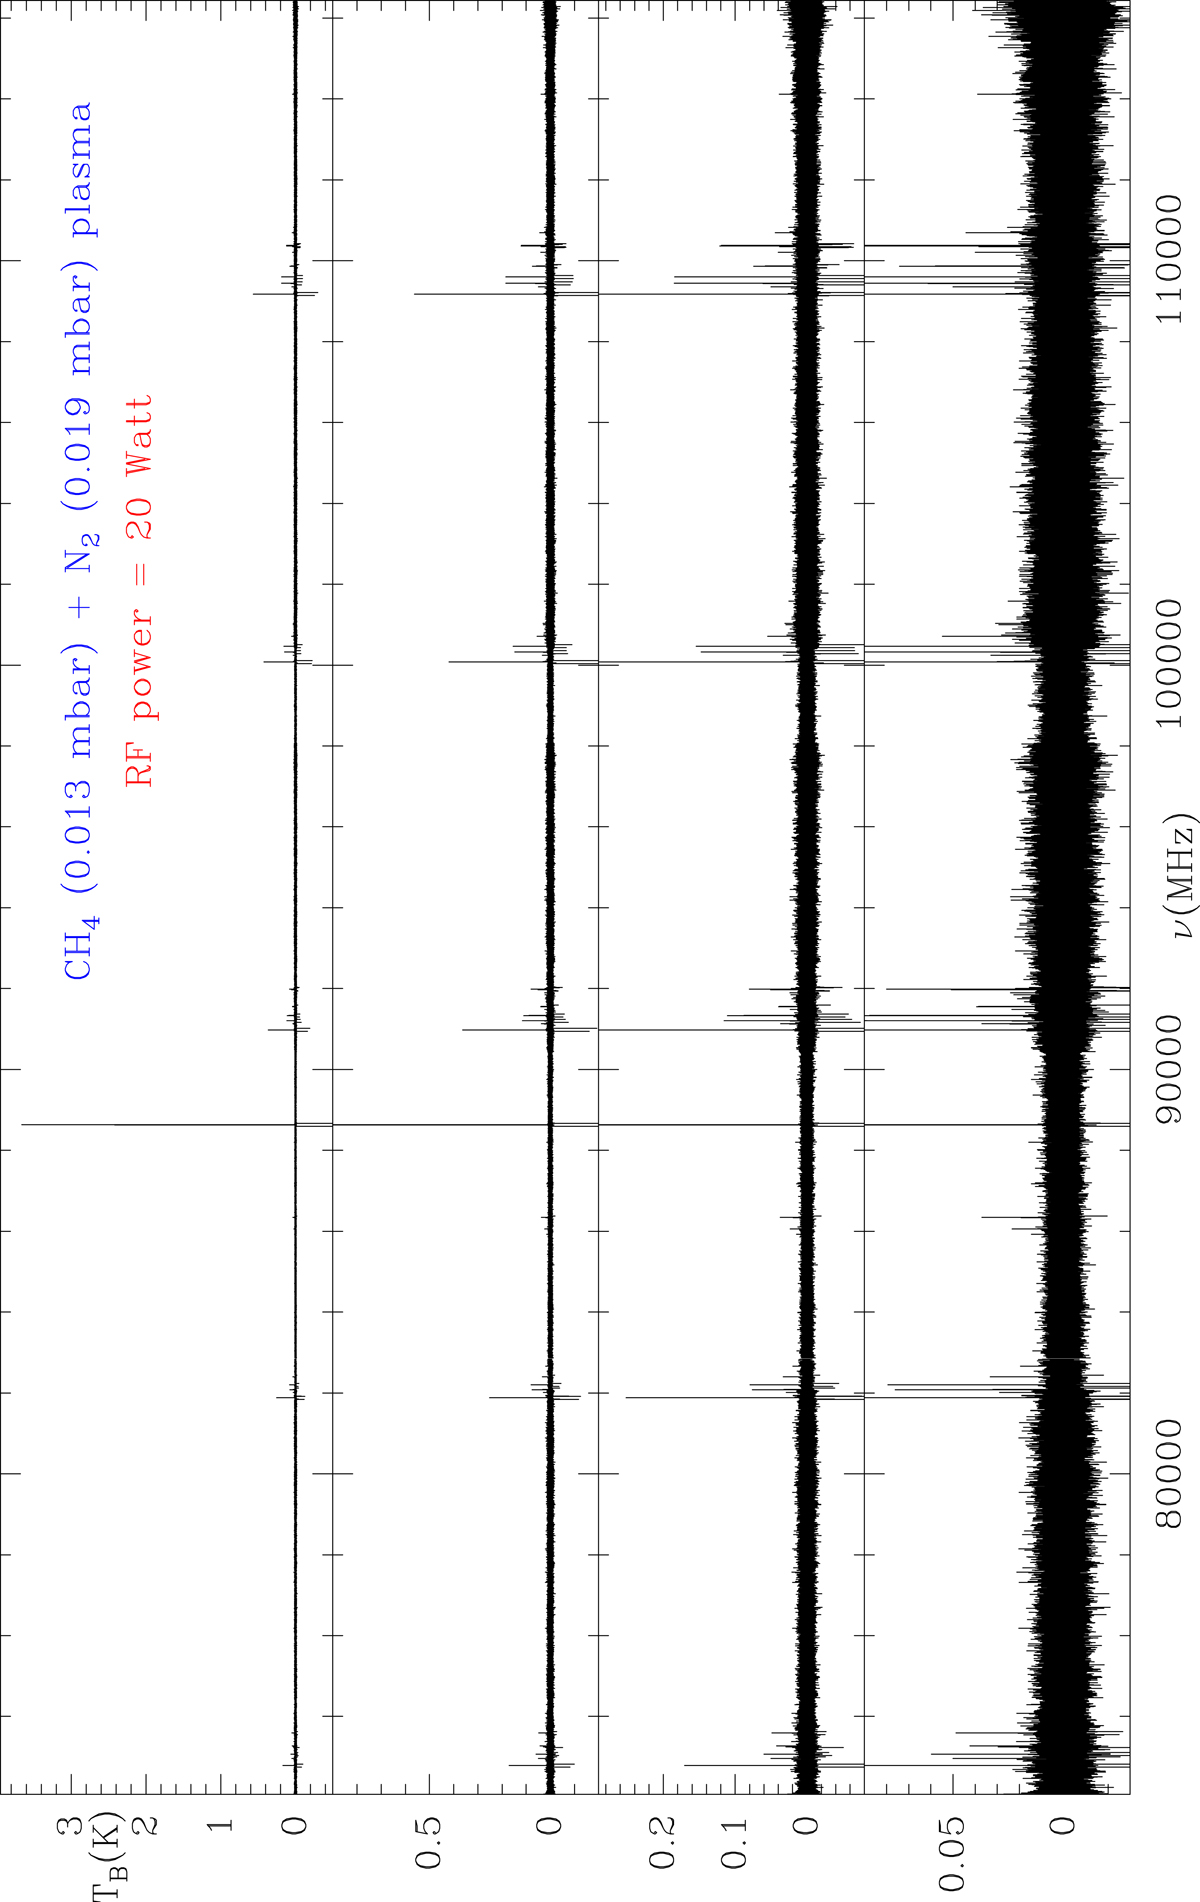
W-band spectrum of a CH4 and N2 plasma at a total pressure of 32.4 × 10⁻³ mbar and a RF power of 20 W. The total integration time was 40 min per W sub-band. The observations were performed in frequency switching mode. The strongest feature corresponds to HCN. The features above the noise level correspond to HC3N in the ground state and in the ν7 and 2ν7 modes. Many weak features correspond to CH3CN. The frequency domain 82–91 GHz is observed in both WL and WM sub-bands, and shows a better S/N. The same happens with the range 95.5–101 GHz that is observed in both WM and WH sub-bands.
Current usage metrics show cumulative count of Article Views (full-text article views including HTML views, PDF and ePub downloads, according to the available data) and Abstracts Views on Vision4Press platform.
Data correspond to usage on the plateform after 2015. The current usage metrics is available 48-96 hours after online publication and is updated daily on week days.
Initial download of the metrics may take a while.