Fig. C.2.
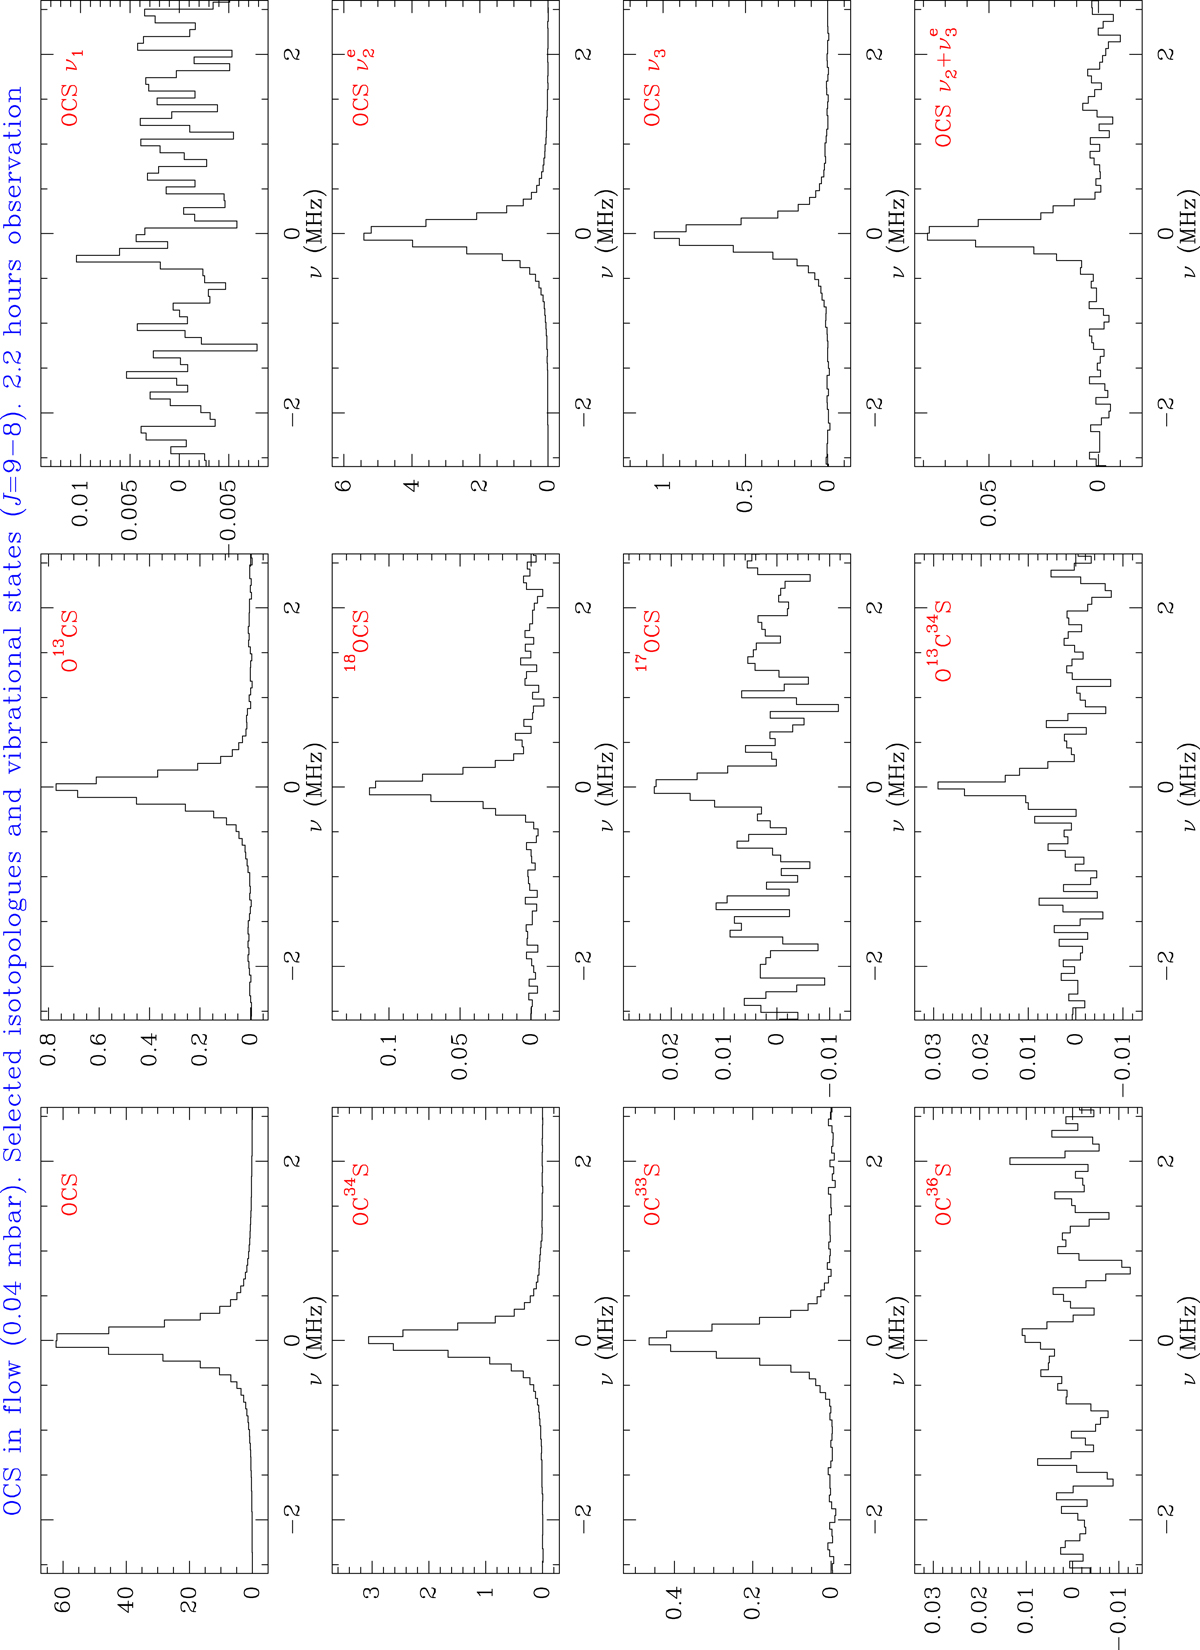
Observation of OCS at a total pressure of 0.04 mbar in the chamber using the frequency switching observing mode. Each panel shows the J = 9 → 8 transition of different isotopologues of OCS. All these lines are located in the WH sub-band, which has a total observing time of 2.2 h (see also Figs. C.1 and 12). The data shown in this figure have been smoothed by a two-channel box procedure.
Current usage metrics show cumulative count of Article Views (full-text article views including HTML views, PDF and ePub downloads, according to the available data) and Abstracts Views on Vision4Press platform.
Data correspond to usage on the plateform after 2015. The current usage metrics is available 48-96 hours after online publication and is updated daily on week days.
Initial download of the metrics may take a while.