Fig. C.1.
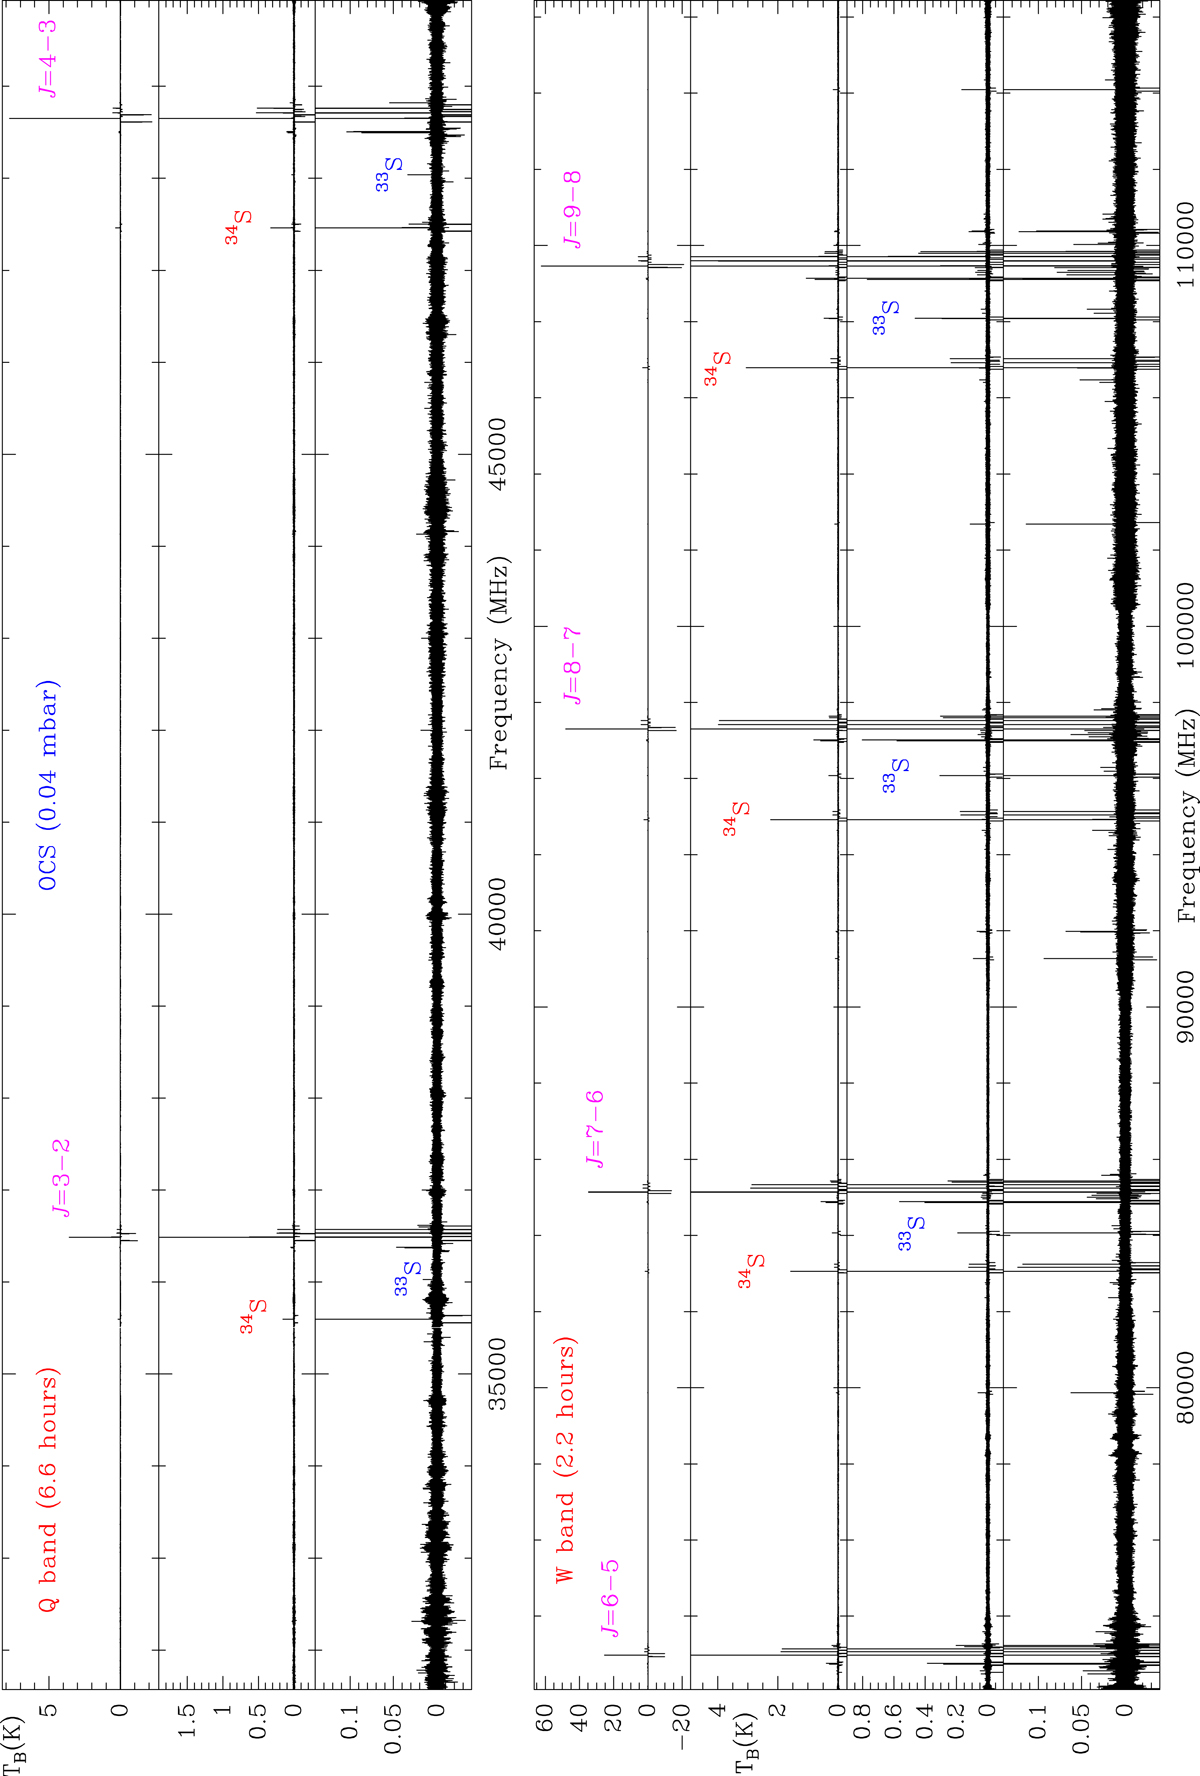
Q-band (top panels) and W-band (bottom panels) observations of OCS at a total pressure of 0.04 mbar in the chamber. The frequency switching mode has been used with a throw of 37 MHz. The different panels for each band always show the same frequency range but with a different intensity scale. The observing time per W sub-band (WL, WM, and WH) is 2.2 h. Hence, the Q band has been observed for 6.6 h. The rotational transitions of the main isotopologue are indicated. Features corresponding to OC34S and OC33S are also indicated. A zoom-in on the J = 9 → 8 transition is shown in Fig. 12. The same transition, but in a narrower frequency range, of OC34S, OC33S, O13CS, O13C34S, 17OCS, 18OCS, and OC36S is shown in Fig. C.2. The different isotopologues of OCS are observed in natural abundance. The negative features seen in the different panels are produced by the folding of the frequency switched data and appear at ±37 MHz of each rotational transition. The data shown in this figure have been smoothed by a two-channel box procedure.
Current usage metrics show cumulative count of Article Views (full-text article views including HTML views, PDF and ePub downloads, according to the available data) and Abstracts Views on Vision4Press platform.
Data correspond to usage on the plateform after 2015. The current usage metrics is available 48-96 hours after online publication and is updated daily on week days.
Initial download of the metrics may take a while.