Fig. 20.
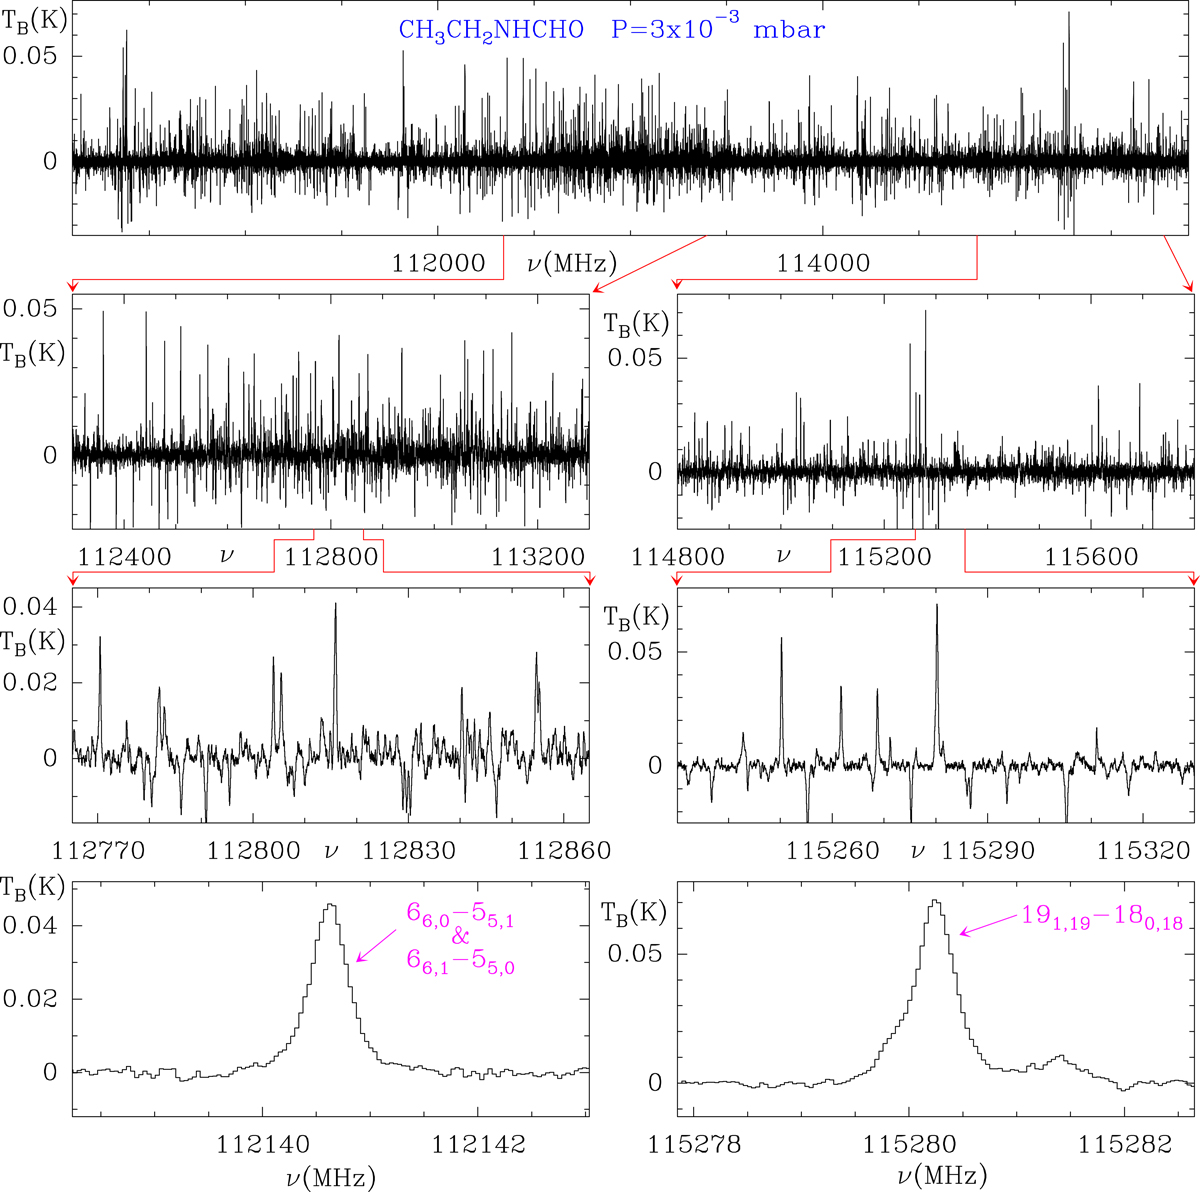
Observed spectrum of N-ethylformamide between 110.1 and 115.9 GHz. The total observing time per W sub-band was 59 h. The observing procedure was frequency switching with a throw of 25 MHz. The pressure in the chamber was 3 × 10⁻³ mbar. The intensity scale is in K and the frequency scale in MHz. The different panels show different magnifications of the data of the upper panel. The two lines at the bottom have a linewidth of ≃0.4 MHz. The 191, 19–180, 18 transition shows a shoulder at lower frequencies produced by a line arising from one of the low-lying vibrationally excited states or from the conformers trans-ap or cis-ac (the expected hyperfine splitting for this transition is ≃15 kHz).
Current usage metrics show cumulative count of Article Views (full-text article views including HTML views, PDF and ePub downloads, according to the available data) and Abstracts Views on Vision4Press platform.
Data correspond to usage on the plateform after 2015. The current usage metrics is available 48-96 hours after online publication and is updated daily on week days.
Initial download of the metrics may take a while.