Fig. 18.
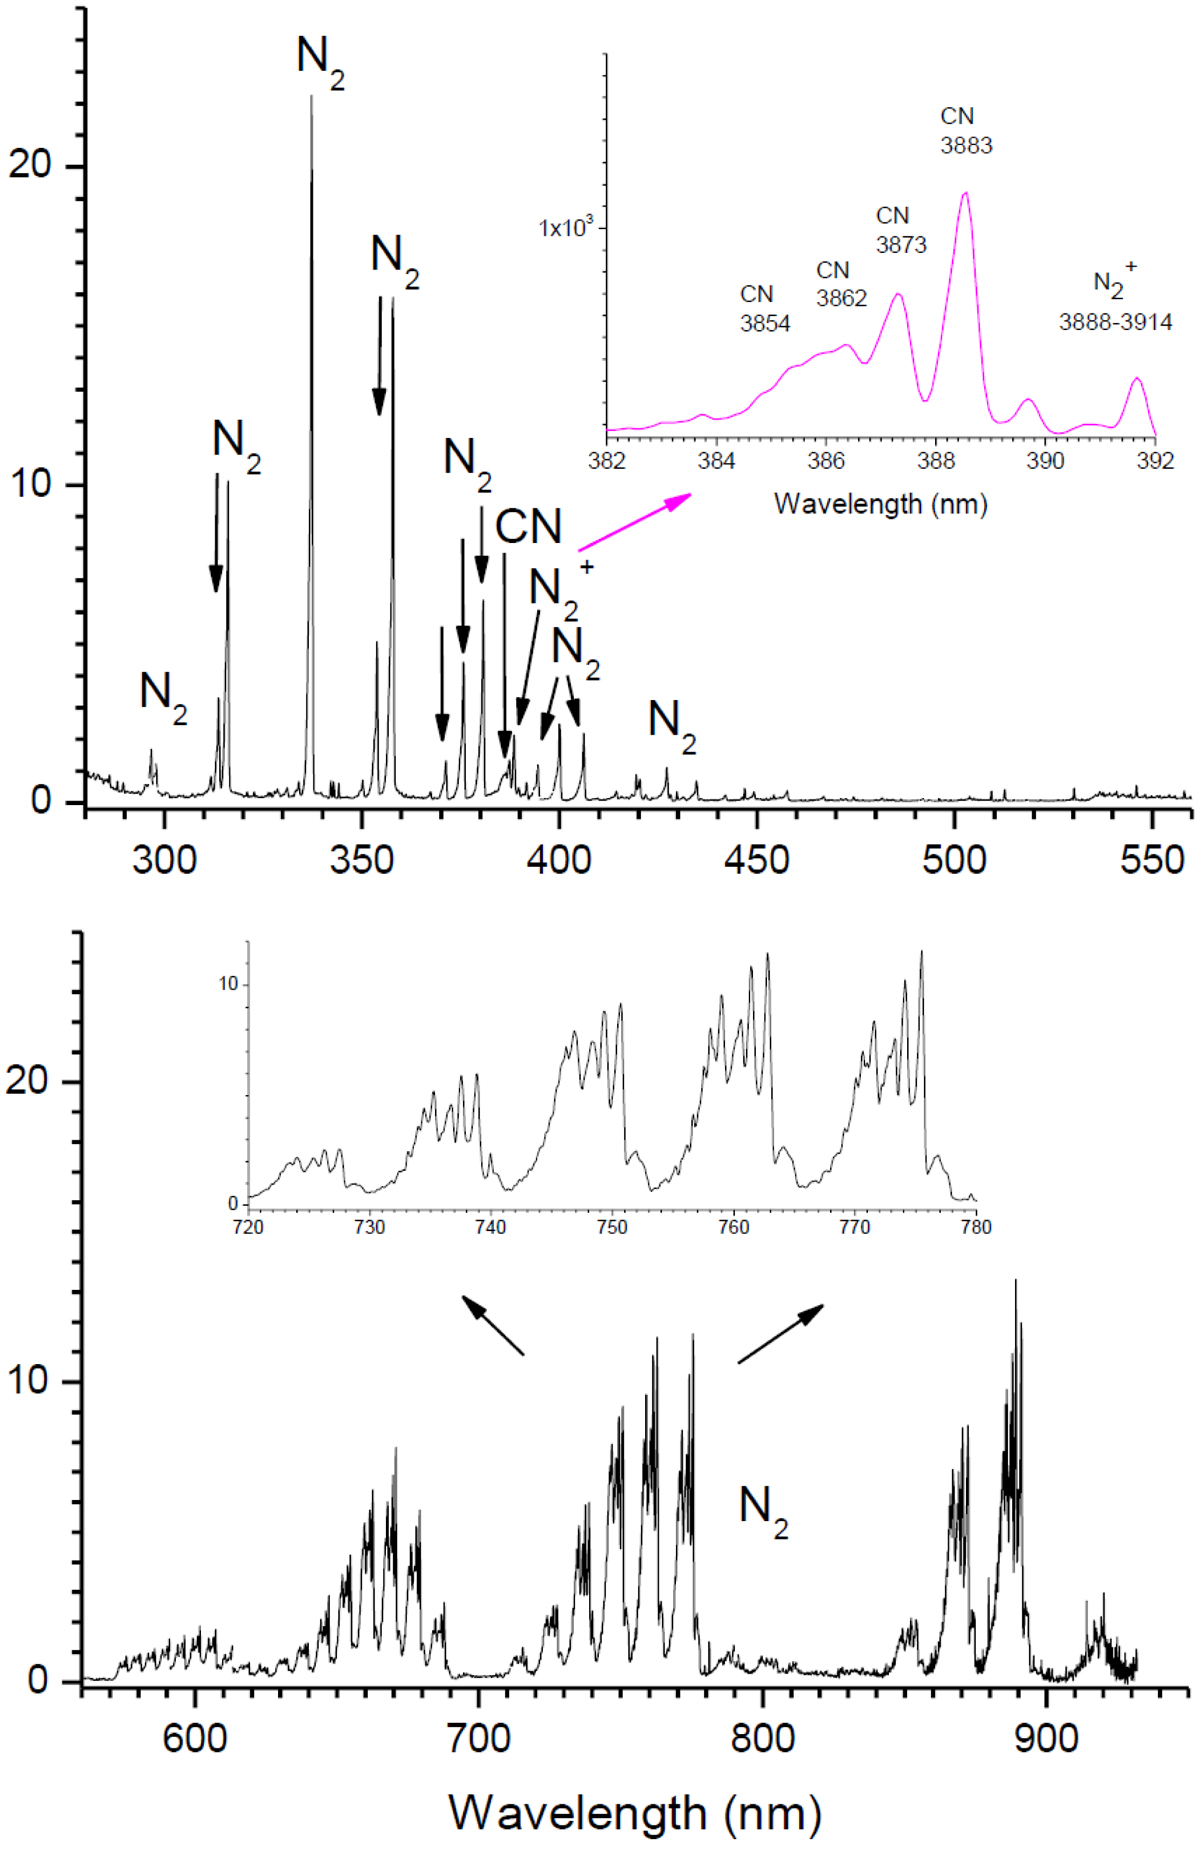
Optical spectrum between 280 and 560 nm (top) and between 560 and 950 nm (bottom) of a plasma produced in a flowing mixture of CH4 (1 sccm) and N2 (1 sccm). The inserts show the CN, ![]() , and N2 bands. The corresponding mass spectrum is shown in Fig. 17, and the results from the rotational spectroscopy during this plasma experiment are shown in Fig. 16.
, and N2 bands. The corresponding mass spectrum is shown in Fig. 17, and the results from the rotational spectroscopy during this plasma experiment are shown in Fig. 16.
Current usage metrics show cumulative count of Article Views (full-text article views including HTML views, PDF and ePub downloads, according to the available data) and Abstracts Views on Vision4Press platform.
Data correspond to usage on the plateform after 2015. The current usage metrics is available 48-96 hours after online publication and is updated daily on week days.
Initial download of the metrics may take a while.