Fig. 13.
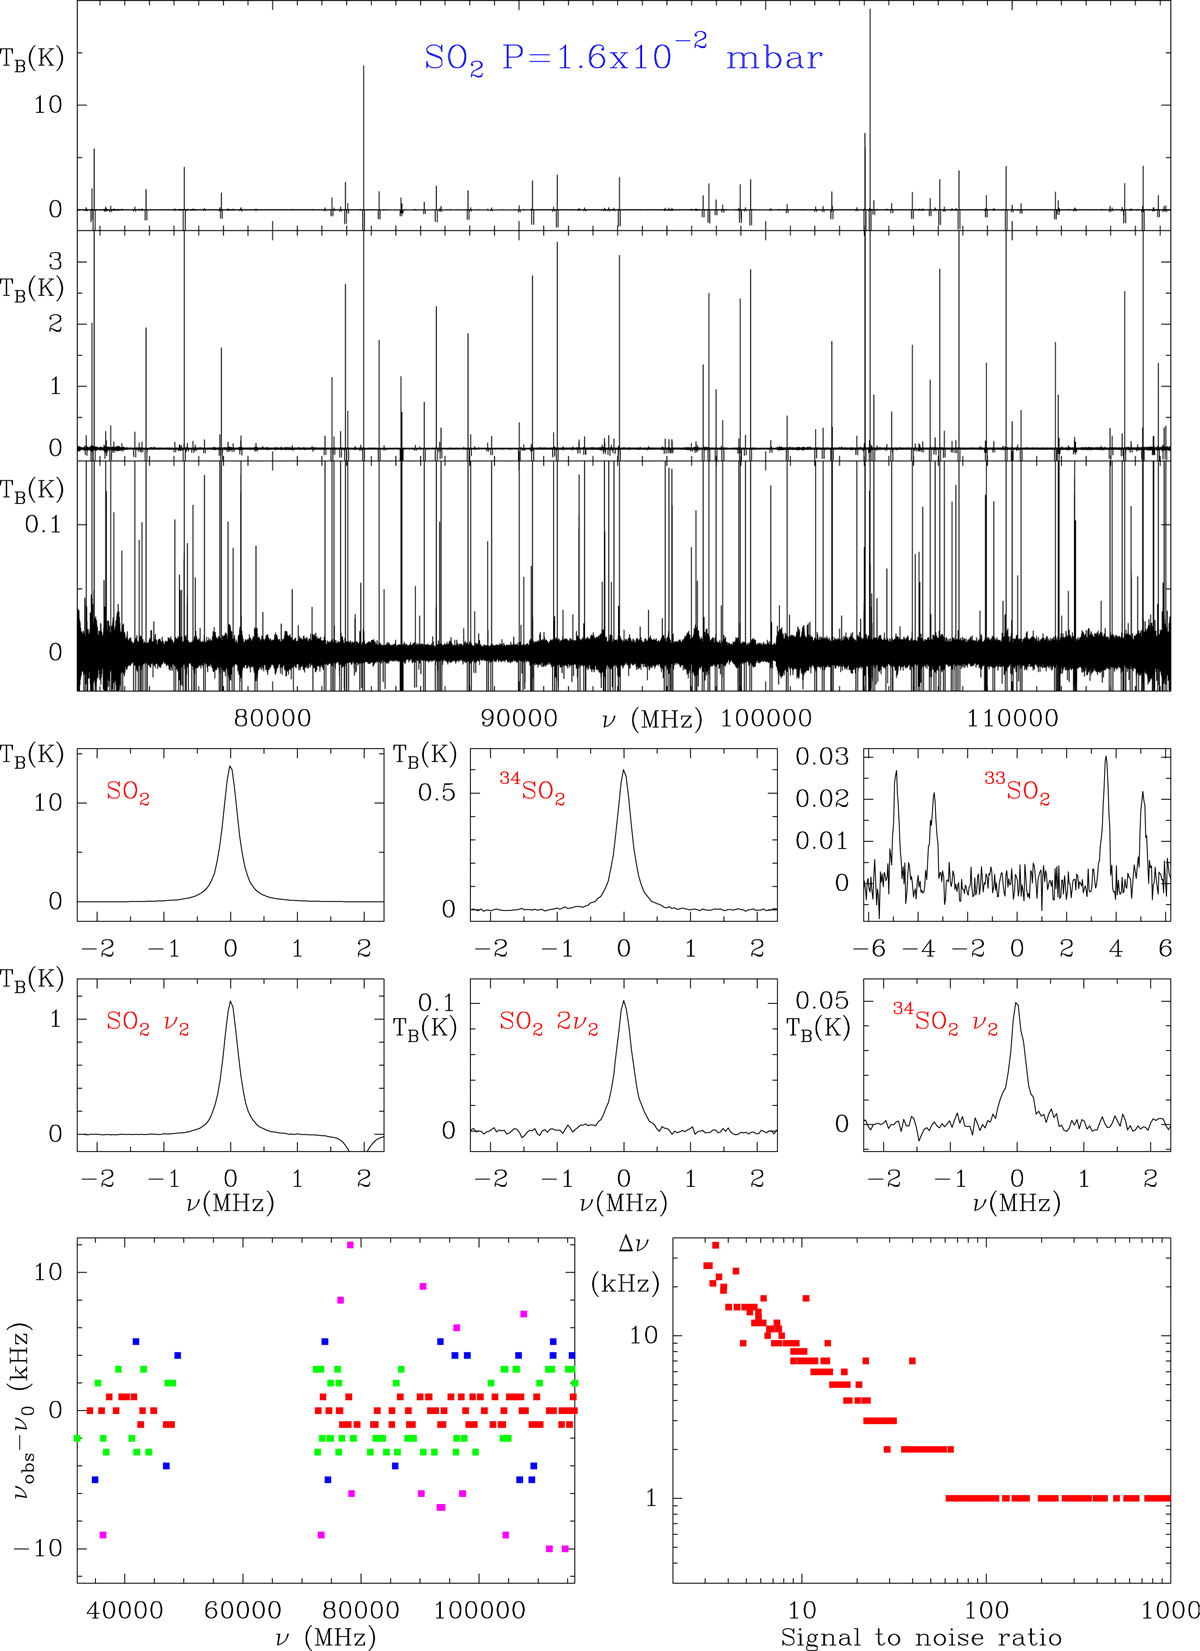
Observed spectrum of SO2 in the W band. The integration time per W sub-band was 4.4 h. Three upper panels: W band with different intensity scales. Middle panels: 81, 7−80, 8 transition of SO2, 34SO2, 33SO2, SO2 ν2 and 2ν2, and 34SO2 ν2. The strongest hyperfine components of 33SO2 are clearly detected. Data for all lines observed during this experiment are given in Table C.1. Bottom left panel: difference, Δν(kHz), between the observed frequencies and those found in the CDMS (Müller et al. 2005), JPL (Pickett et al. 1998), and MADEX (Cernicharo 2012) catalogues. The colours correspond to different degrees of accuracy: |Δν(kHz)| ≤ 2 (red; 75 lines), 2 < |Δν(kHz)| ≤ 4 (green; 53 lines), 4< |Δν(kHz)| ≤6 (blue; 17 lines), and 6 < |Δν(kHz)| ≤ 12 (purple; 16 lines). Bottom right panels: uncertainty (in kHz) assigned by the Gaussian fitting algorithm of the CLASS/GILDAS program to all observed lines in the W band as a function of the S/N of the peak intensity.
Current usage metrics show cumulative count of Article Views (full-text article views including HTML views, PDF and ePub downloads, according to the available data) and Abstracts Views on Vision4Press platform.
Data correspond to usage on the plateform after 2015. The current usage metrics is available 48-96 hours after online publication and is updated daily on week days.
Initial download of the metrics may take a while.