Fig. 12.
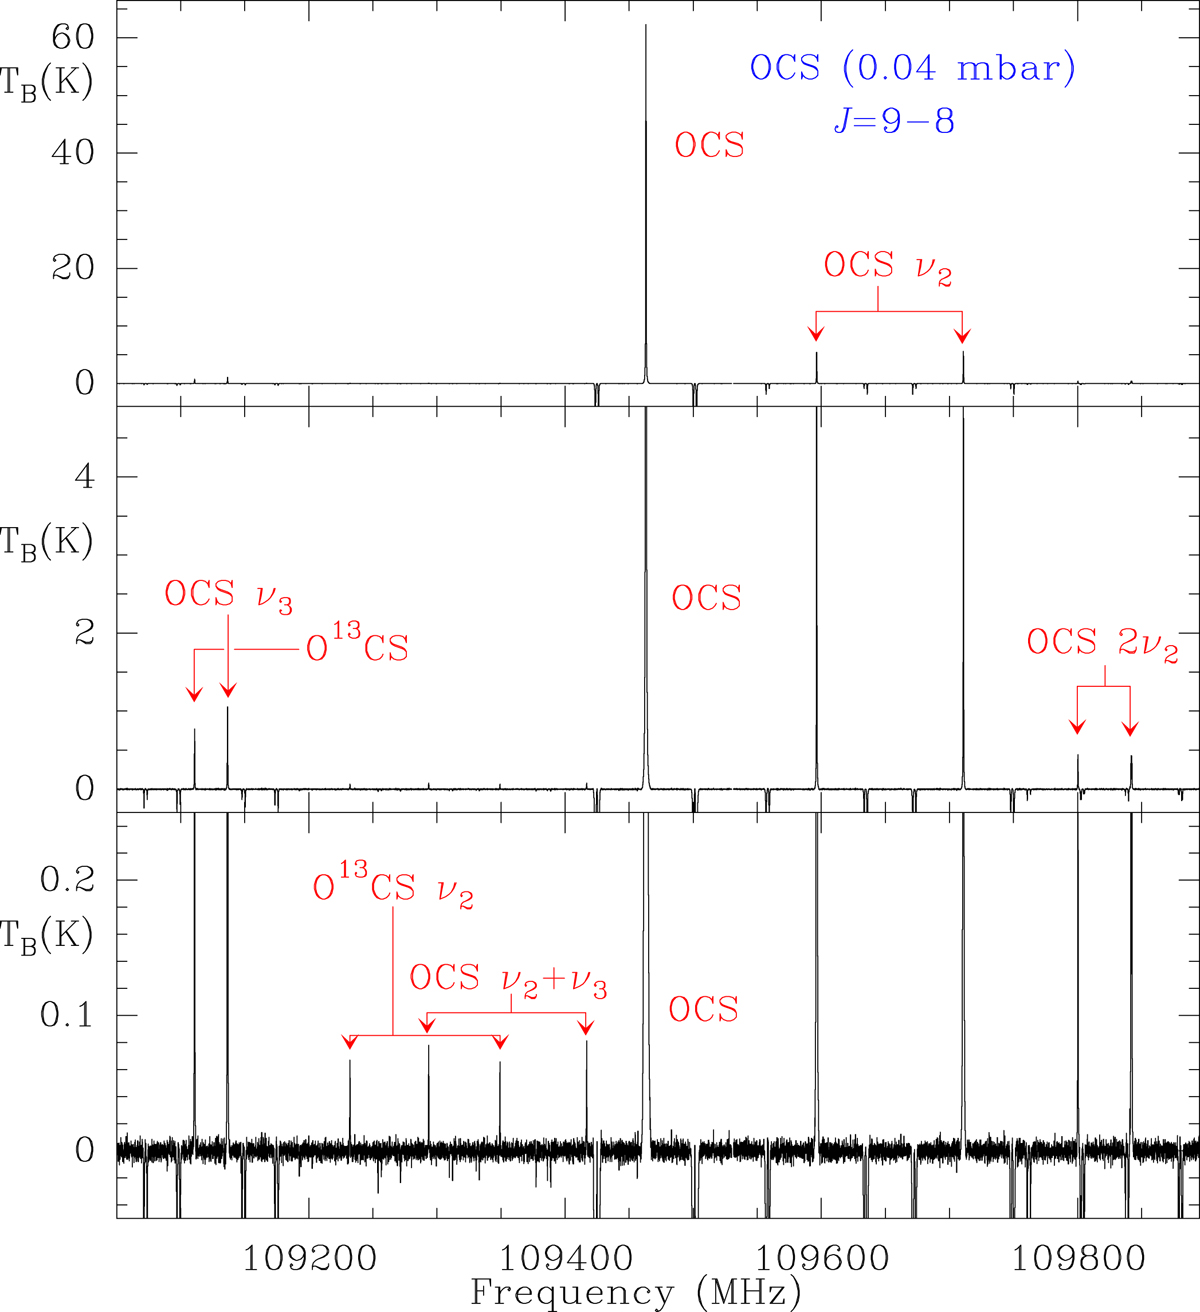
Observation of OCS at a total pressure of 0.04 mbar in the chamber using a frequency switching observing procedure. The different panels show the 109050–109895 MHz frequency domain within the WH sub-band, but with different intensity scale limits (in K). Individual features are identified. The total observing time in this frequency range is 2.2 h. The negative features seen in the different panels are produced by the folding of the frequency switched data and appear at ±37 MHz of each rotational transition (see also Figs. C.1 and C.2).
Current usage metrics show cumulative count of Article Views (full-text article views including HTML views, PDF and ePub downloads, according to the available data) and Abstracts Views on Vision4Press platform.
Data correspond to usage on the plateform after 2015. The current usage metrics is available 48-96 hours after online publication and is updated daily on week days.
Initial download of the metrics may take a while.