Fig. 5.
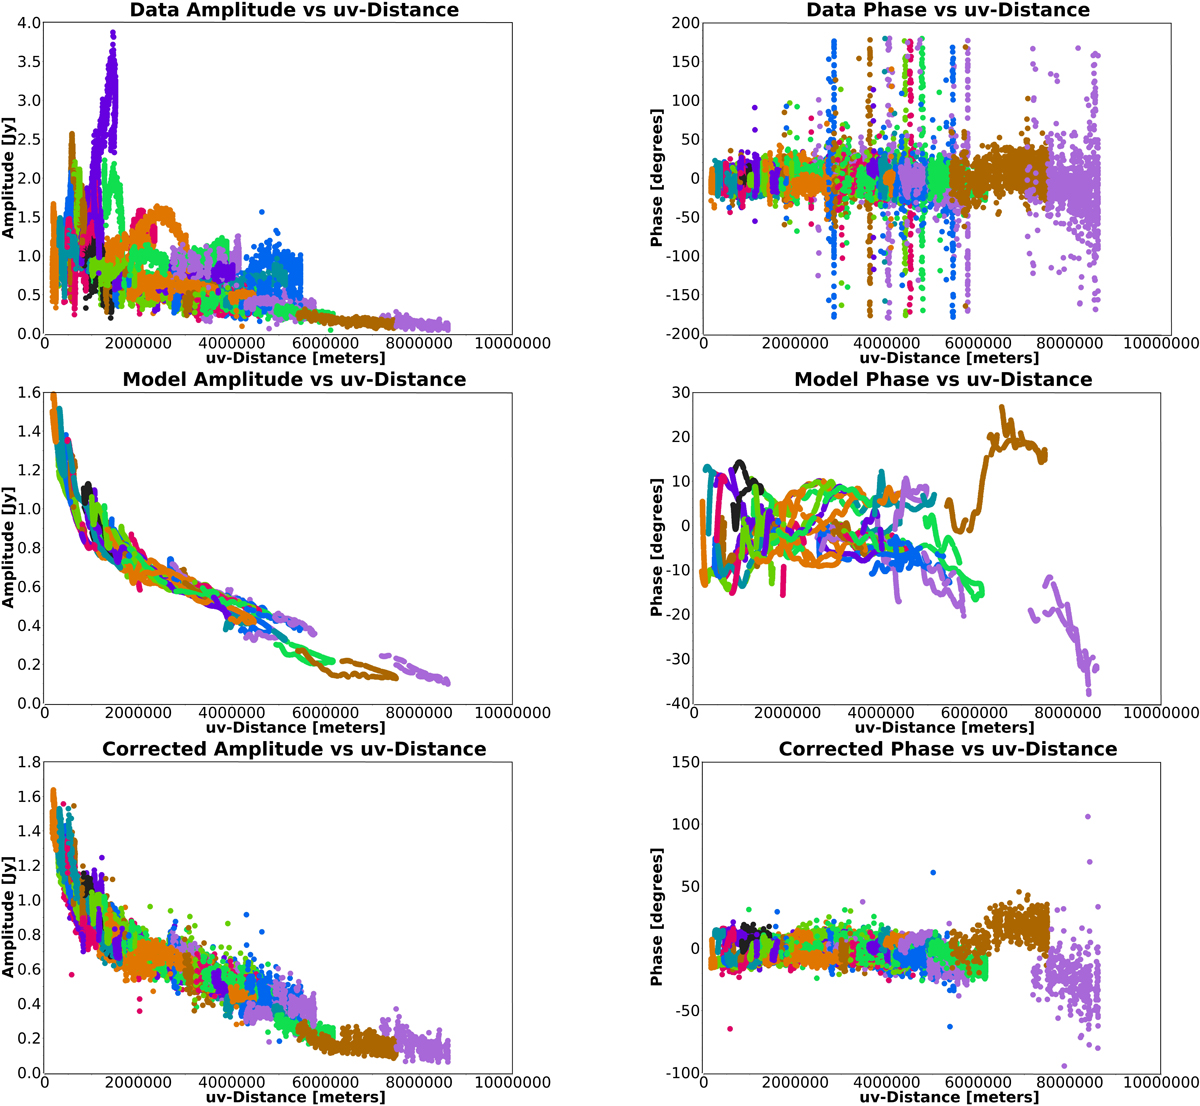
M 87 amplitudes on the left and phases on the right as a function of baseline length (u-v distance), color-coded by baselines. Top panels: visibilities after the model-agnostic rPICARD calibration (before self-calibration). Middle panel: model data from the final image of the imaging plus self-calibration cycles, shown in Fig. 6. Bottom panel: data after the last round of self-calibration. In the model-agnostic calibration, anomalously high amplitudes are due to station gain errors; the system temperature measurements of the Fort Davis and Owens Valley stations were doubtful. Large residual phase trends are related to low S/N measurements, where long fringe fit solution intervals are chosen by rPICARD. These amplitude and phase trends are both corrected for with the iterative self-calibration.
Current usage metrics show cumulative count of Article Views (full-text article views including HTML views, PDF and ePub downloads, according to the available data) and Abstracts Views on Vision4Press platform.
Data correspond to usage on the plateform after 2015. The current usage metrics is available 48-96 hours after online publication and is updated daily on week days.
Initial download of the metrics may take a while.