Fig. 3.
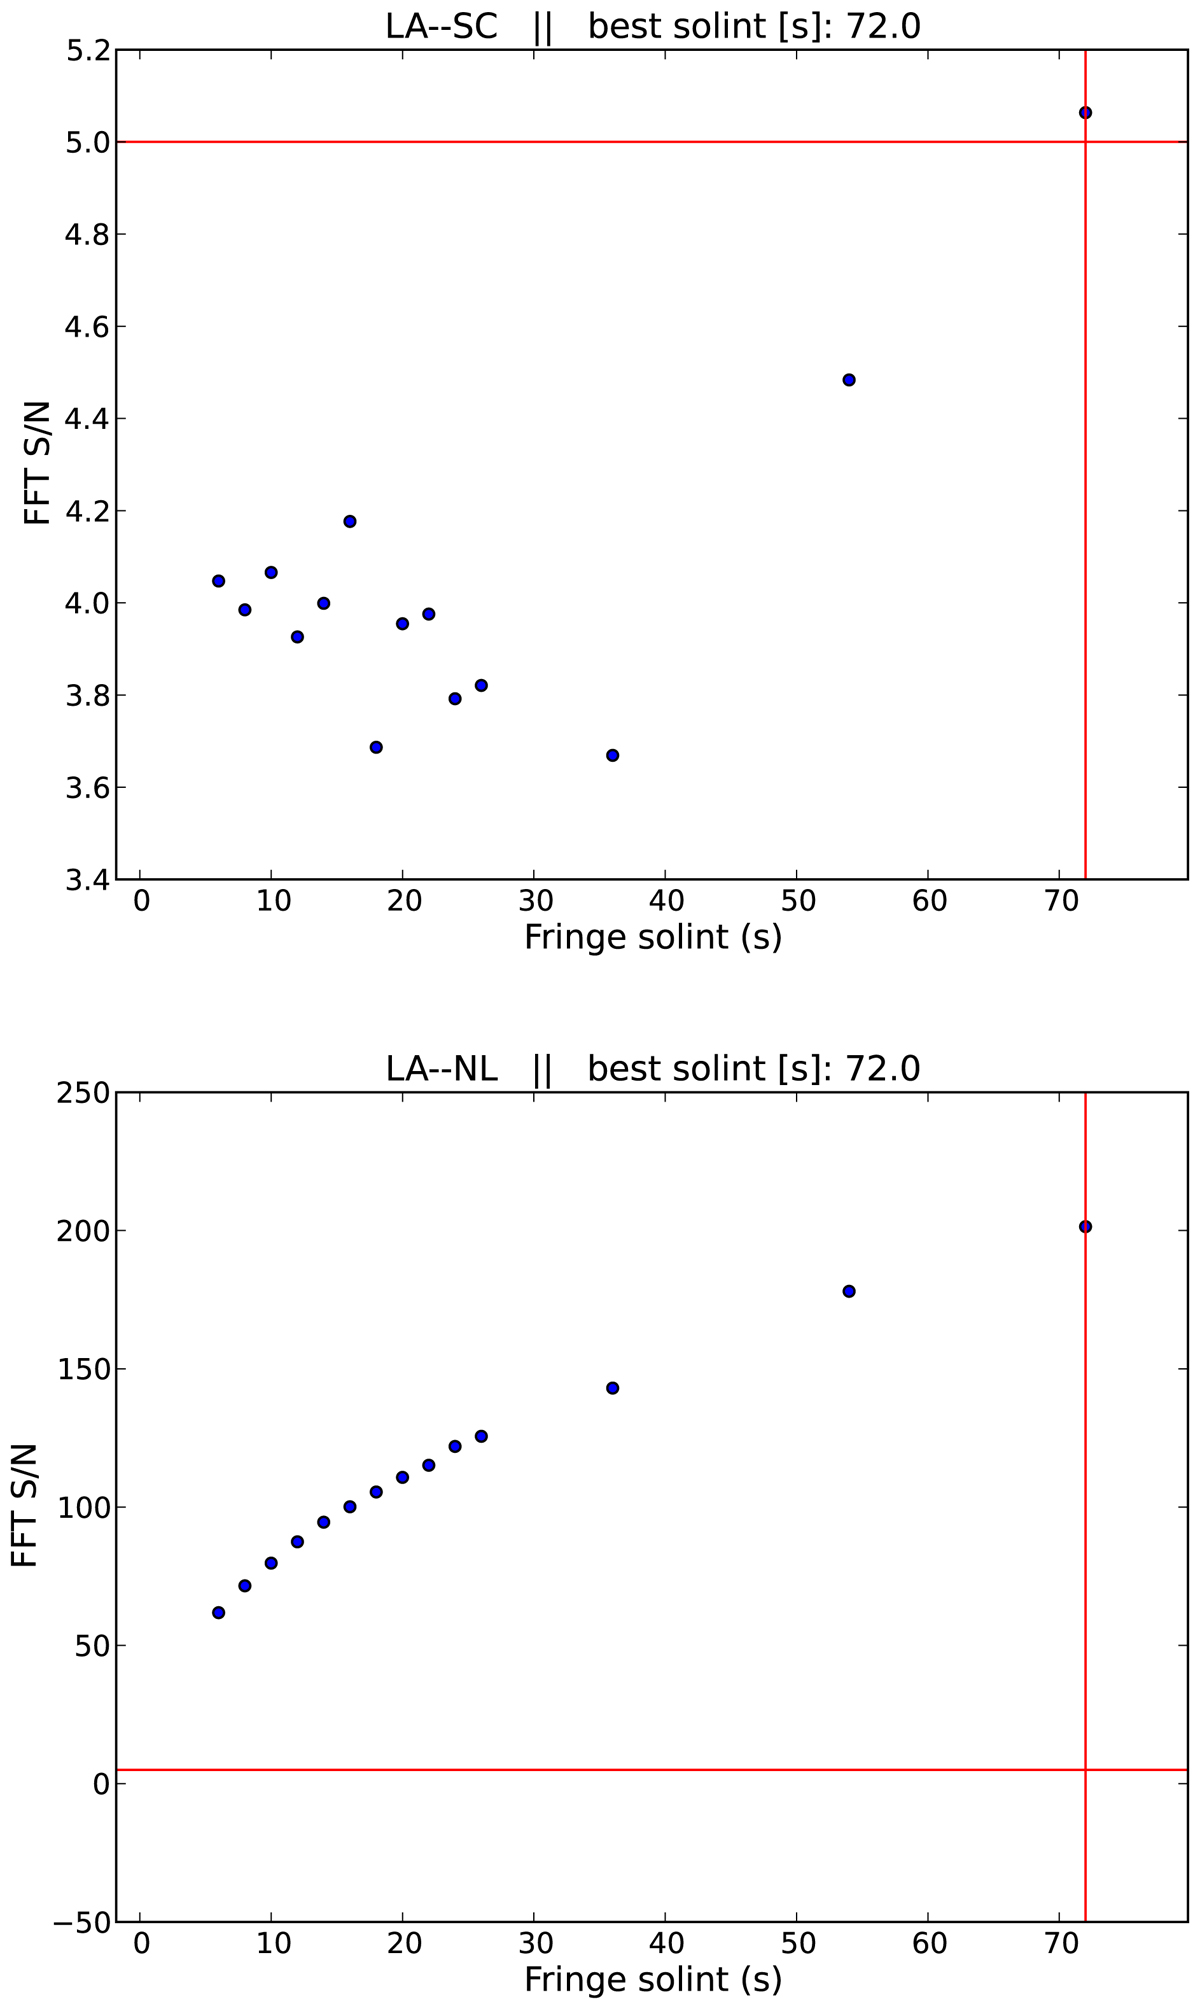
Example plots of a fringe fit solution interval optimization search based on 7 mm VLBA data (Sect. 6). Los Alamos (LA) is chosen as the reference station for the scan shown. The blue points show the FFT S/N as a function of solution interval, the horizontal red line indicates the S/N cutoff of 5 on each baseline, and the vertical red line shows the smallest solution interval of 72 s needed to reach the S/N cutoff on each baseline for this scan. The top plot shows the baseline to the Saint Croix (SC) station, which has driven the solution interval to higher values until a detection was made when we integrated for 72 s. The bottom plot shows data from the same scan for the baseline to the North Liberty (NL) station, where the source was detected for each solution interval, yielding the expected increase in S/N with the square root of the solution interval.
Current usage metrics show cumulative count of Article Views (full-text article views including HTML views, PDF and ePub downloads, according to the available data) and Abstracts Views on Vision4Press platform.
Data correspond to usage on the plateform after 2015. The current usage metrics is available 48-96 hours after online publication and is updated daily on week days.
Initial download of the metrics may take a while.