Fig. 2.
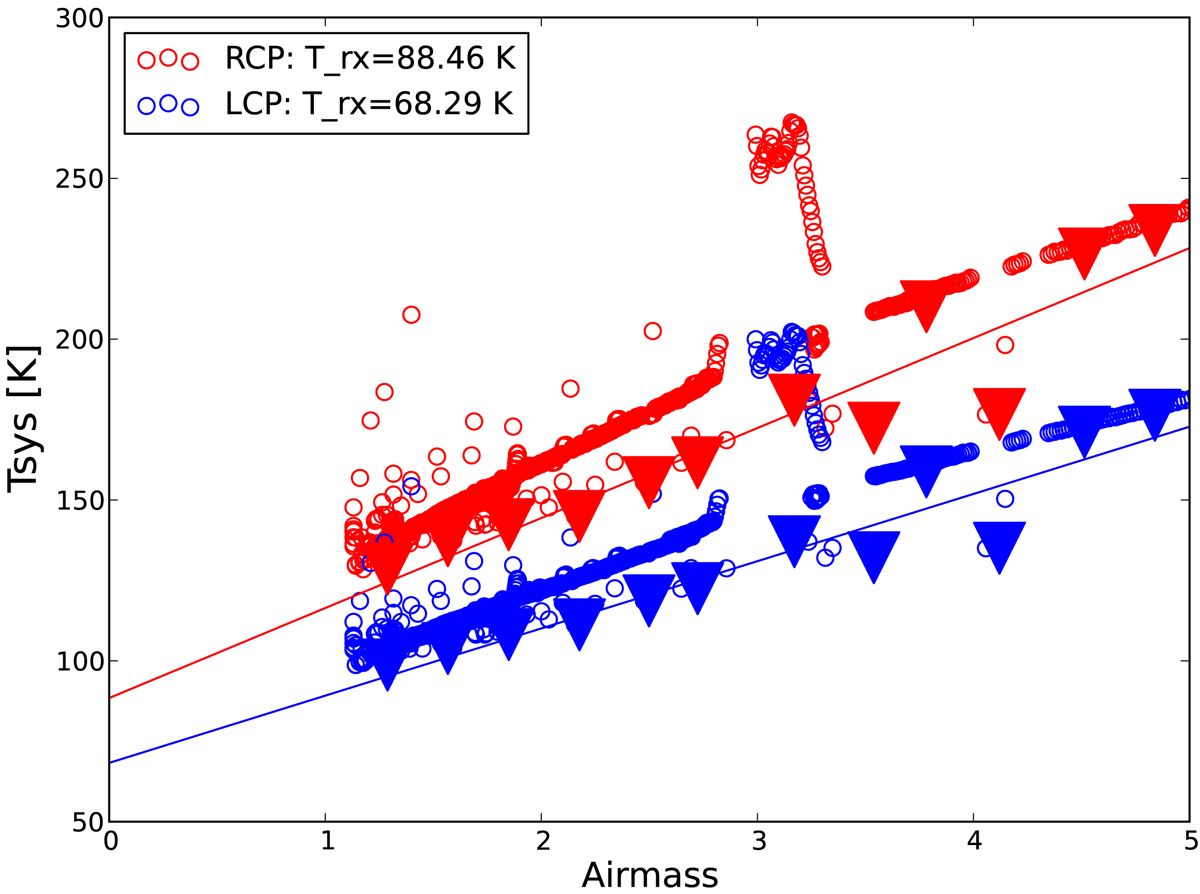
System temperature from the Brewster VLBA station at 7 mm on 04 June 2013 as a function of airmass (given by 1/sin (elevation)) for the RCP and LCP receivers (red and blue open circles, respectively). Overplotted are solid triangles from the lowest Tsys values in each bin of 0.3 airmass size, which are used to determine the receiver temperature by fitting a straight line to the lower Tsys envelope (formed by the binning). Small Tsys variations induced by weather (e.g., the jump seen at an airmass of ∼3) do not affect the fit.
Current usage metrics show cumulative count of Article Views (full-text article views including HTML views, PDF and ePub downloads, according to the available data) and Abstracts Views on Vision4Press platform.
Data correspond to usage on the plateform after 2015. The current usage metrics is available 48-96 hours after online publication and is updated daily on week days.
Initial download of the metrics may take a while.