Fig. 1.
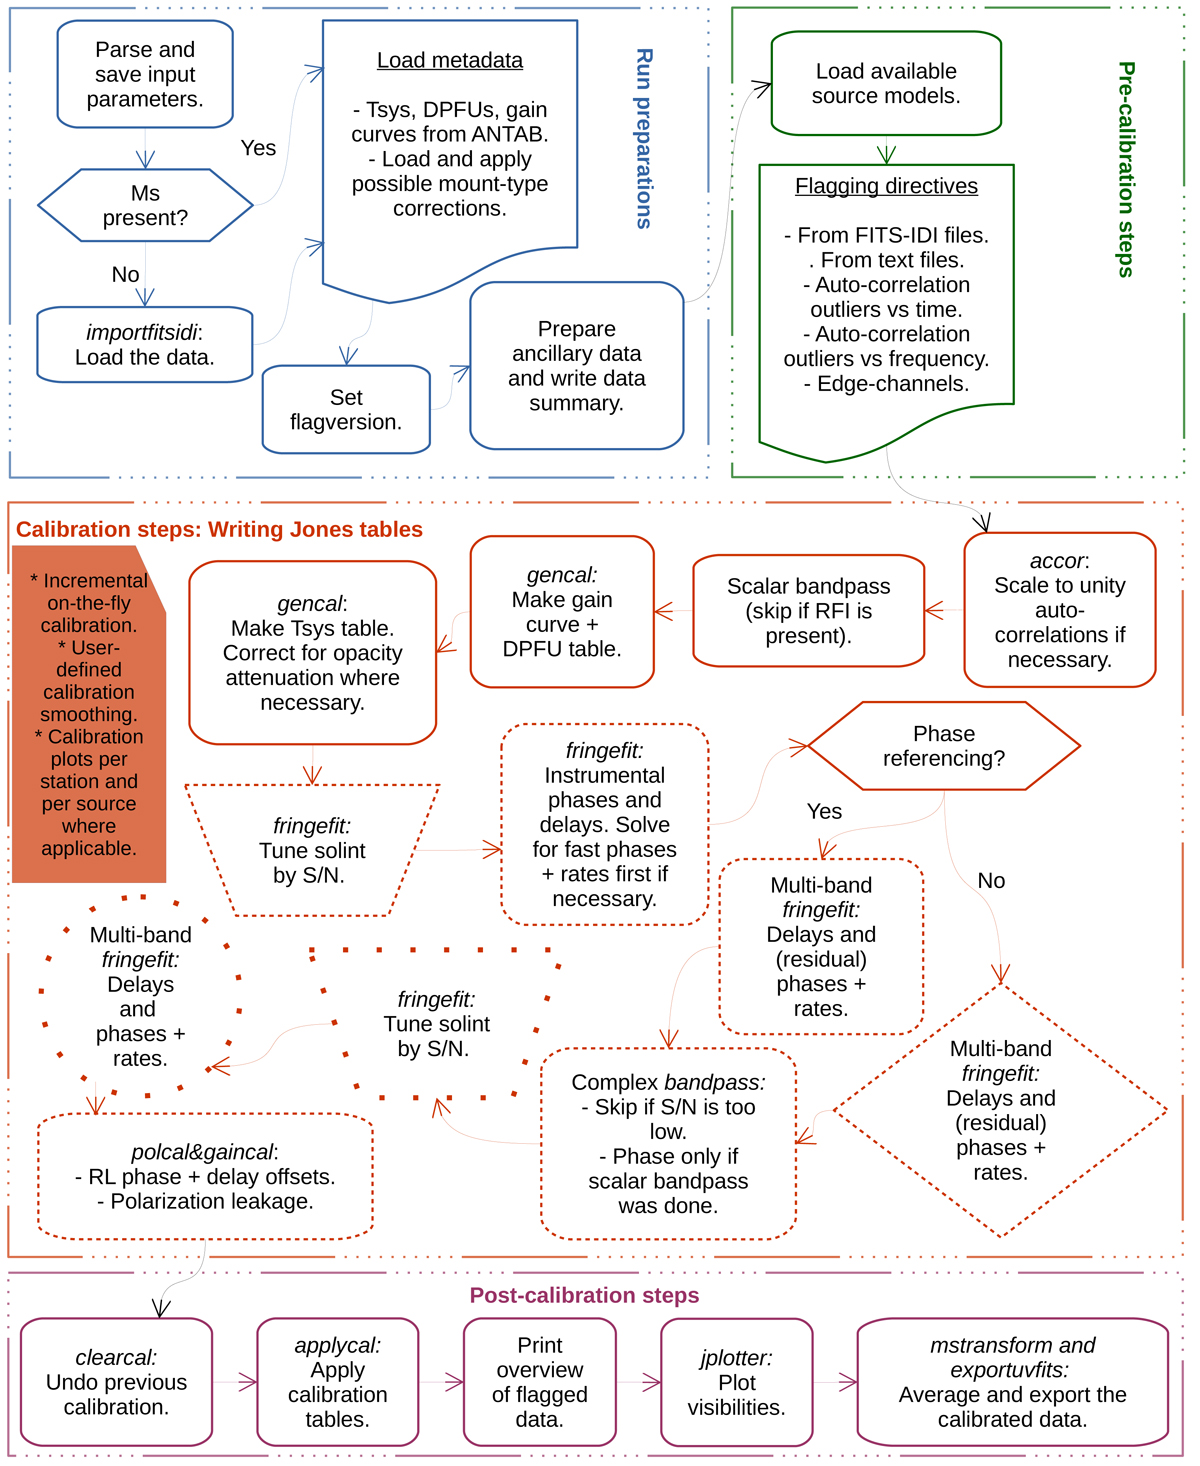
Overview of the rPICARD calibration scheme. CASA tasks used by the pipeline are written in italics. In the orange block in the middle, distinctions are made based on which sources are used to solve for the specific calibration tables and to which sources these tables are applied. Boxes with a solid border belong to calibration steps where all sources were used to obtain solutions. Dashed borders mean that only calibrators were used, and dotted borders correspond to solutions obtained from the science targets only. The line style of the borders only describes the source selection; an averaging of solutions from different sources is not implied. Rectangular boxes indicate solutions that are applied to all sources. Diamonds represent solutions applied to calibrators only, circles are used when the solutions are applied to science targets only, and trapezoids indicate intermediate calibration solutions that are not applied to the data.
Current usage metrics show cumulative count of Article Views (full-text article views including HTML views, PDF and ePub downloads, according to the available data) and Abstracts Views on Vision4Press platform.
Data correspond to usage on the plateform after 2015. The current usage metrics is available 48-96 hours after online publication and is updated daily on week days.
Initial download of the metrics may take a while.