Fig. 4.
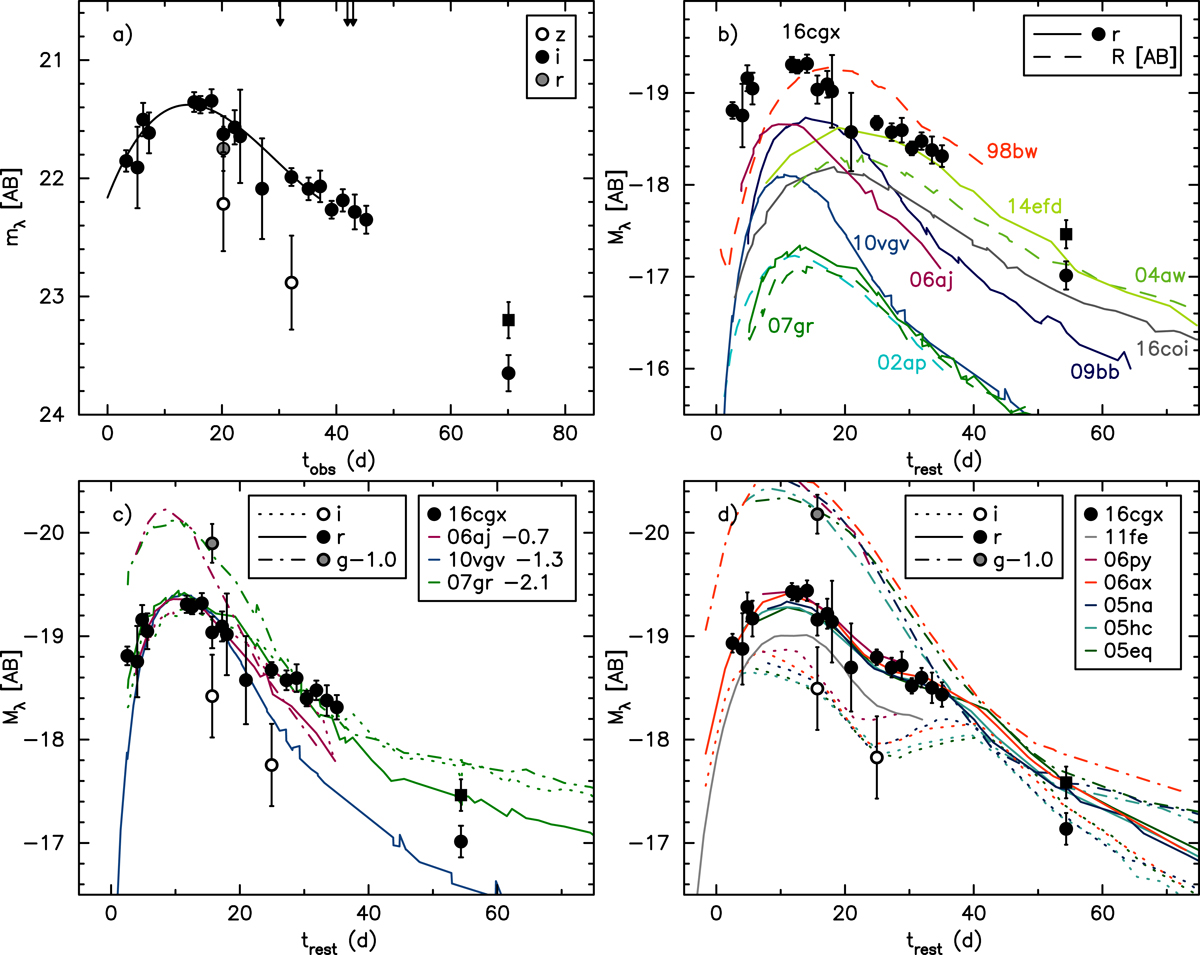
Panel a: observed light curves of PS16cgx. Zero epoch is set to the IceCube-160427A detection. A low-order polynomial light-curve fit is shown with a solid curve. Spectroscopic GMOS (30 days) and FORS2 (42 and 43 days) observations are indicated with vertical arrows. Panel b: PS16cgx r-band absolute light-curve comparison to a selection of nearby Type Ic SNe including the GRB associated Type Ic-BL events (SNe 2006aj and 1998bw); non-GRB associated Type Ic-BL events (PTF10vgv, and SNe 2016coi, 2009bb, and 2002ap); and normal Type Ic events (LSQ14efd, and SNe 2007gr and 2004aw). Panel c: selection of rapidly rising Type Ic SNe arbitrarily shifted as indicated in the figure legend. The comparison indicates an inconsistent spectrophotometric evolution of PS16cgx with Type Ic SNe which cannot be explained with extinction effects. Panel d: PS16cgx gri absolute light-curve comparison to a selection of similar Type Ia SNe. In addition, the slightly fainter r-band light curve of the canonical Type Ia SN 2011fe (Guillochon et al. 2017) is also included in the comparison. Furthermore, as a difference to the previous panels, the light curves of PS16cgx have been arbitrarily corrected for a modest host galaxy extinction of AV = 0.2 mag with RV = 1.27 derived by Burns et al. (2014) as an average value for their Type Ia sample. Assuming that the CFHT template reference image contains contamination from a Type Ia SN at mi = 24.5 mag, the final photometry point is also shown corrected for this effect with a square symbol in all panels.
Current usage metrics show cumulative count of Article Views (full-text article views including HTML views, PDF and ePub downloads, according to the available data) and Abstracts Views on Vision4Press platform.
Data correspond to usage on the plateform after 2015. The current usage metrics is available 48-96 hours after online publication and is updated daily on week days.
Initial download of the metrics may take a while.