Fig. 1.
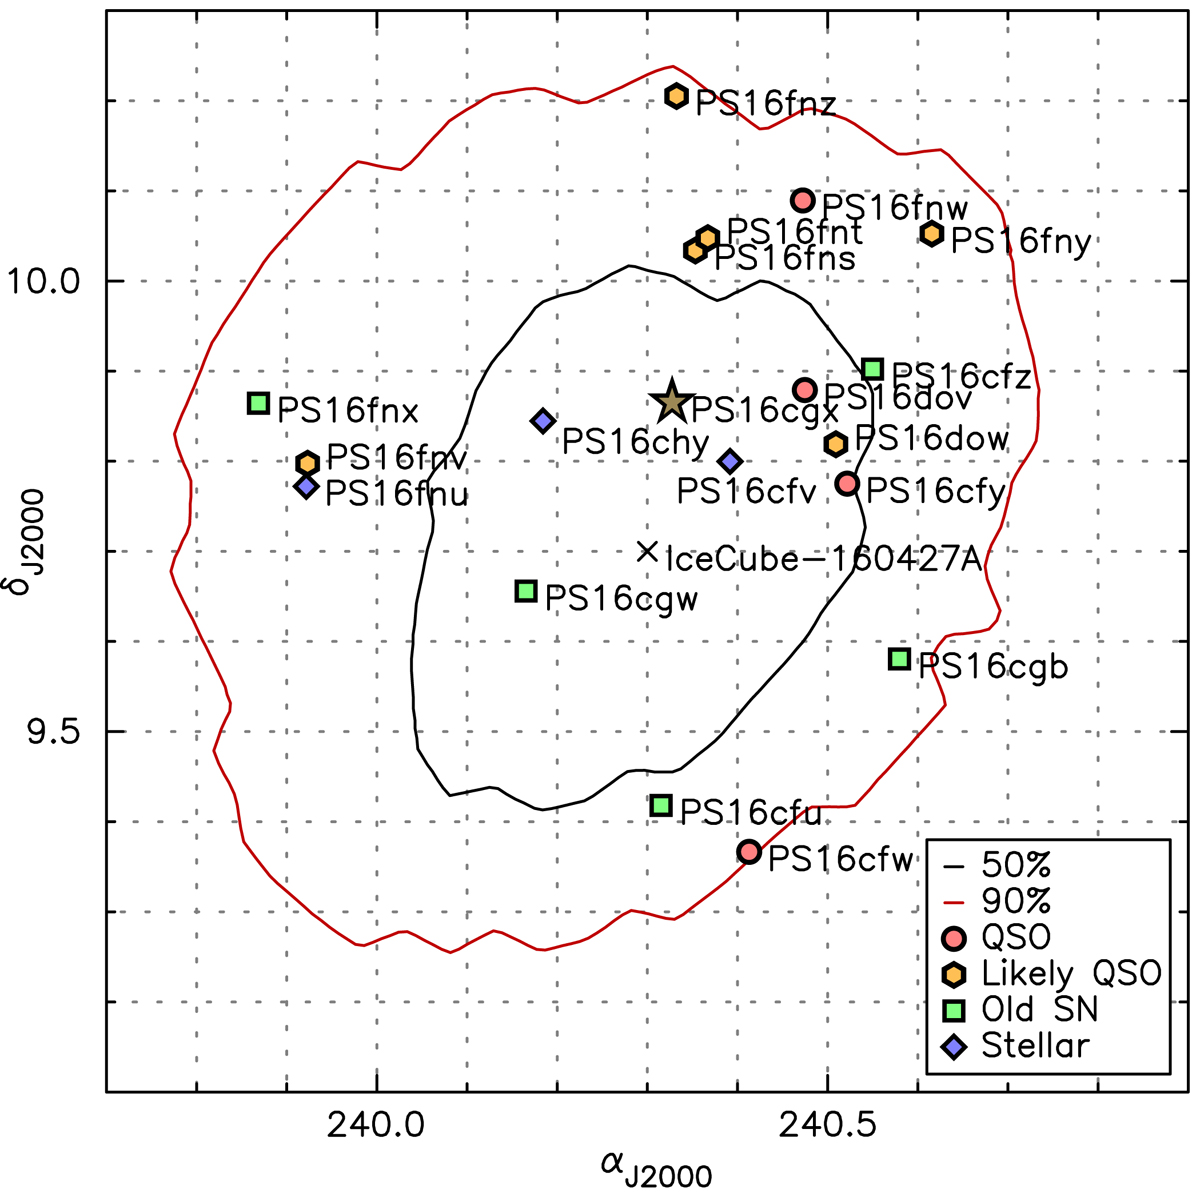
Black (red) line: 50% (90%) confidence region. The confidence region likelihood ratios were determined using Monte Carlo re-simulations of the event, taking into account uncertainties in the optical properties of the deep glacial ice. The best fit position is shown as a × mark and the position of PS16cgx is indicated with a star symbol. Furthermore, the other faint transients discovered within the final 90% probability containment by Pan-STARRS1 are also shown and contextually classified based on their host or precursor information as labeled in the legend.
Current usage metrics show cumulative count of Article Views (full-text article views including HTML views, PDF and ePub downloads, according to the available data) and Abstracts Views on Vision4Press platform.
Data correspond to usage on the plateform after 2015. The current usage metrics is available 48-96 hours after online publication and is updated daily on week days.
Initial download of the metrics may take a while.