Fig. 6.
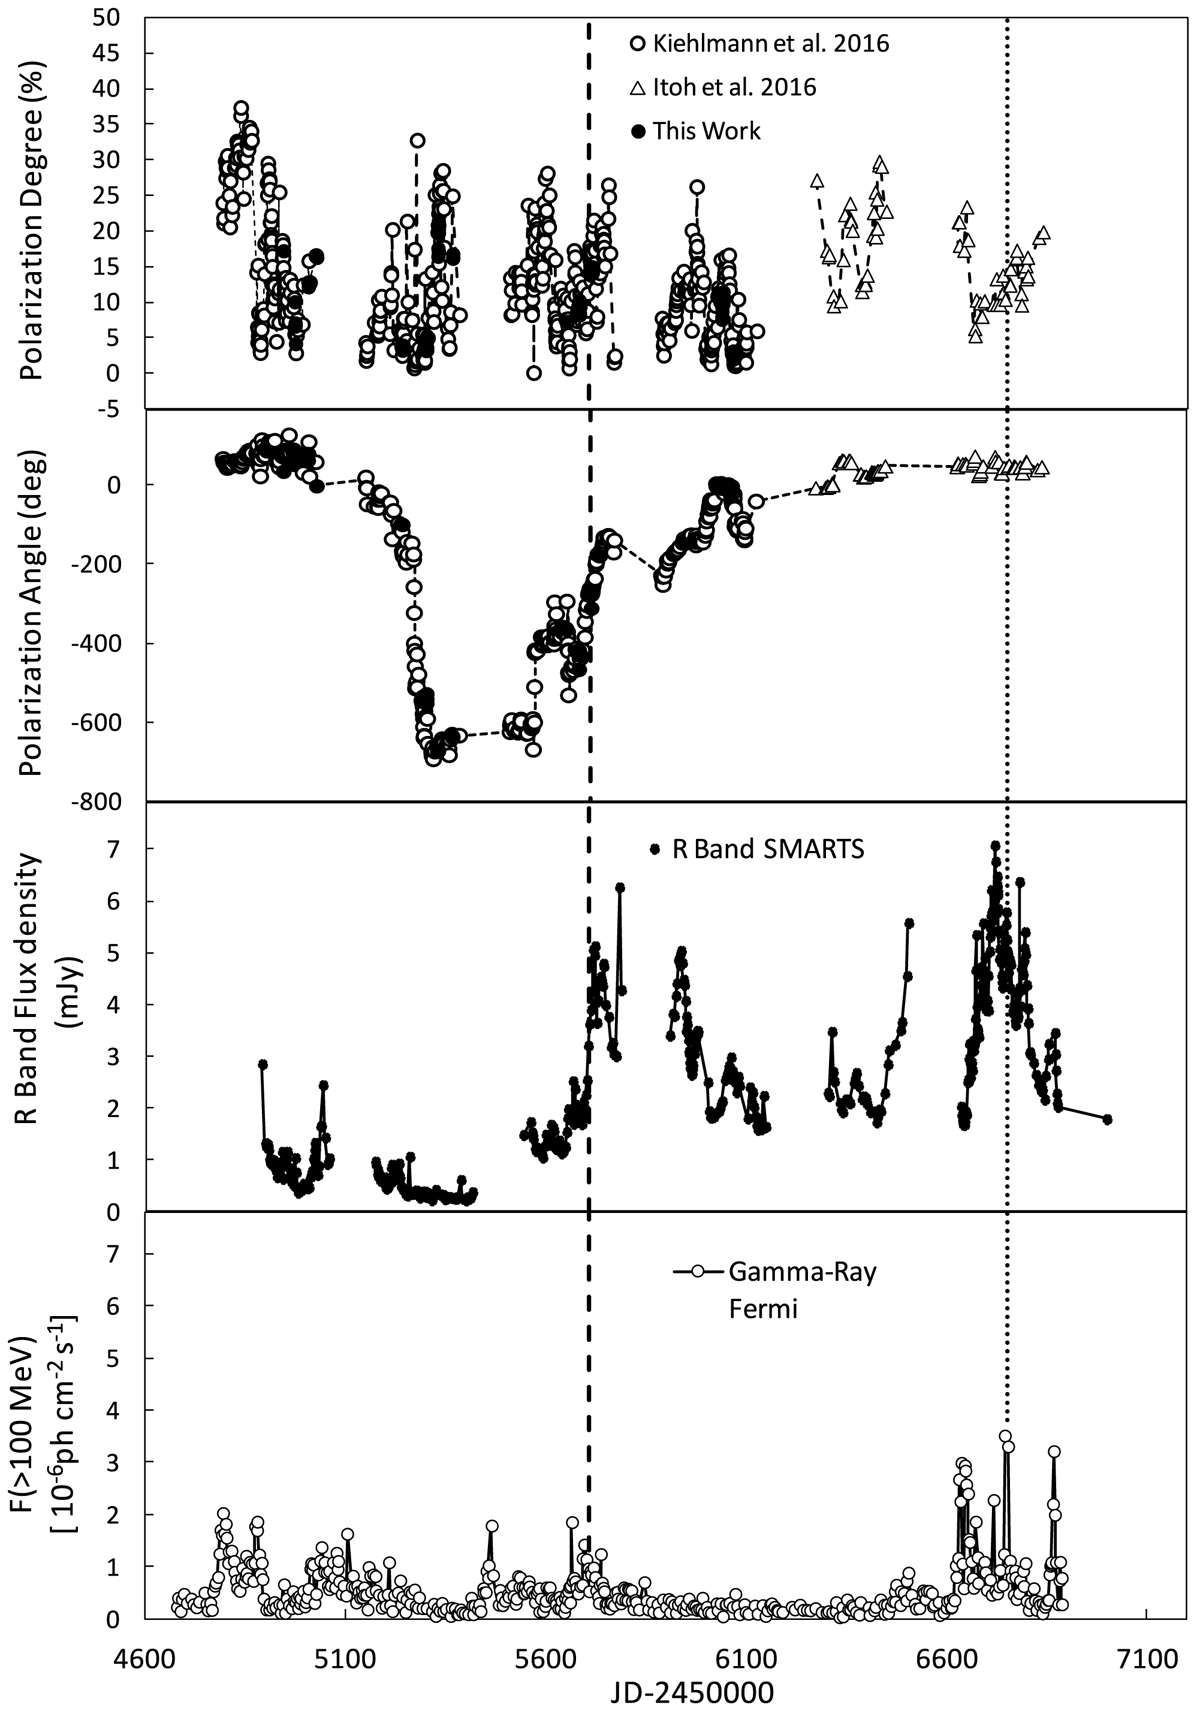
Top: PA variability obtained by Kiehlmann et al. (2016) adding the data of this work. As a criterion to solve the 180° multiplicity we minimized the difference between successive data points. Bottom: R-band and γ-ray variability. The dashed line indicates the γ ray associated with a new jet component reported by Jorstad et al. (2017) that produced a PA rotation, while the dotted line indicates a new jet component seen in VLBI images (Rani et al. 2018) that did not produce changes in PA.
Current usage metrics show cumulative count of Article Views (full-text article views including HTML views, PDF and ePub downloads, according to the available data) and Abstracts Views on Vision4Press platform.
Data correspond to usage on the plateform after 2015. The current usage metrics is available 48-96 hours after online publication and is updated daily on week days.
Initial download of the metrics may take a while.