Fig. 5
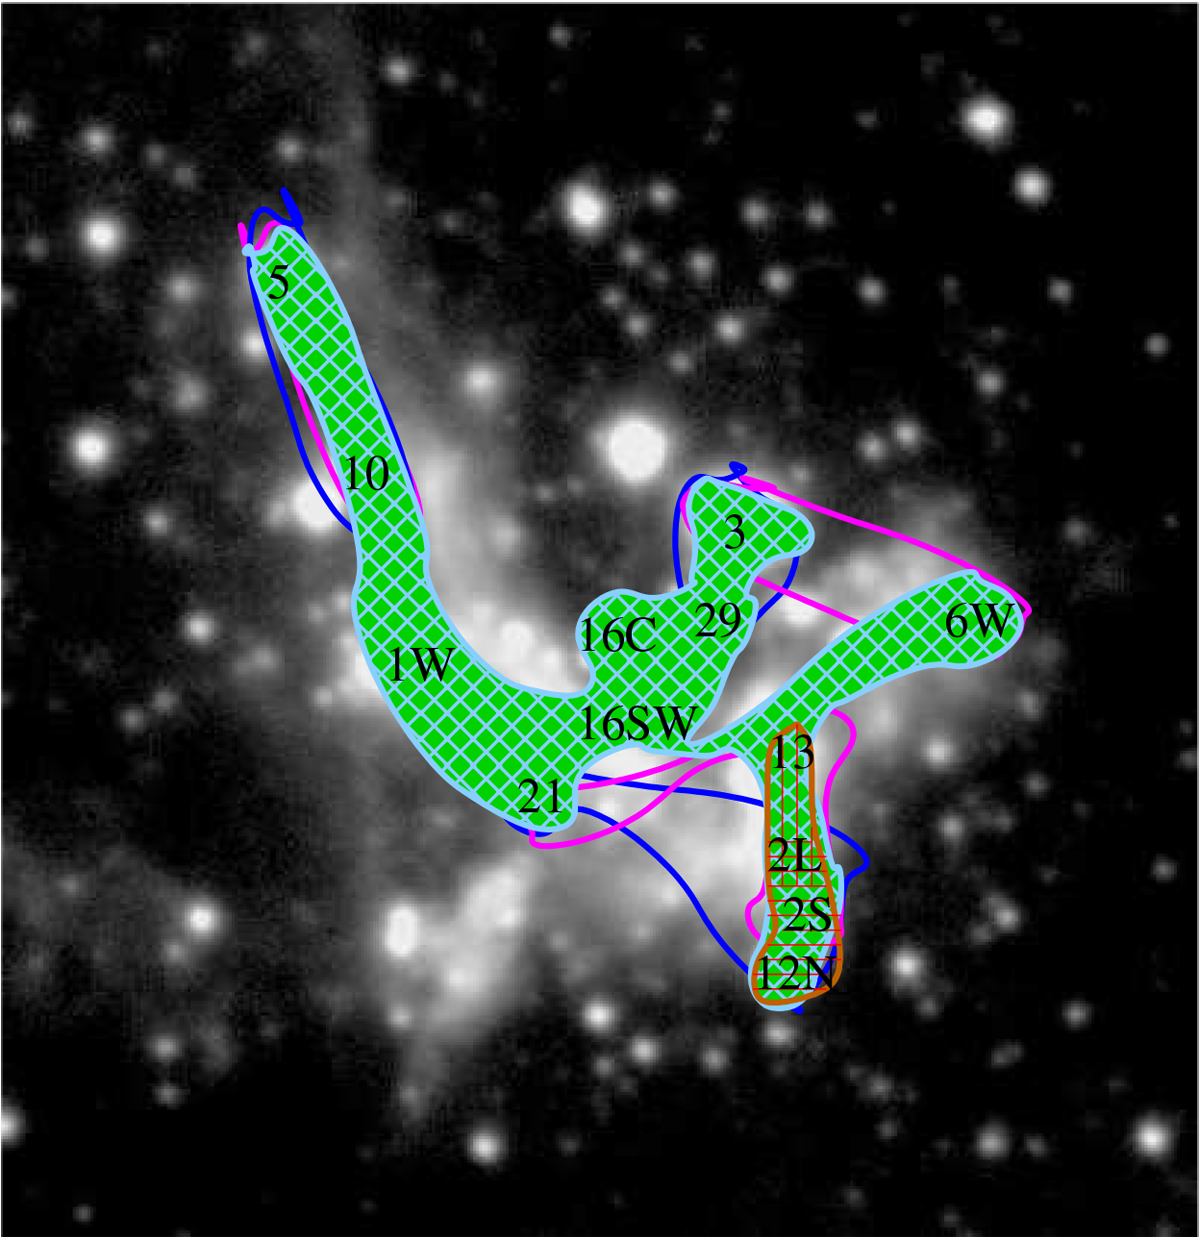
Schematic view of the bright-continuum-emitting regions in the central parsec that are affected by absorption of −145, −85, −60, −40 and 50 km s−1 clouds (in light blue dashed with green), the −185 km s−1 cloud (in magenta), the −130 km s−1 cloud (in blue), the −210 km s−1 IRS 13-2L-2S-12N complex cloud (in brown), and the 60 and −110 km s−1 minispiral material (dashed red vertically and horizontally, respectively).
Current usage metrics show cumulative count of Article Views (full-text article views including HTML views, PDF and ePub downloads, according to the available data) and Abstracts Views on Vision4Press platform.
Data correspond to usage on the plateform after 2015. The current usage metrics is available 48-96 hours after online publication and is updated daily on week days.
Initial download of the metrics may take a while.