Fig. 3
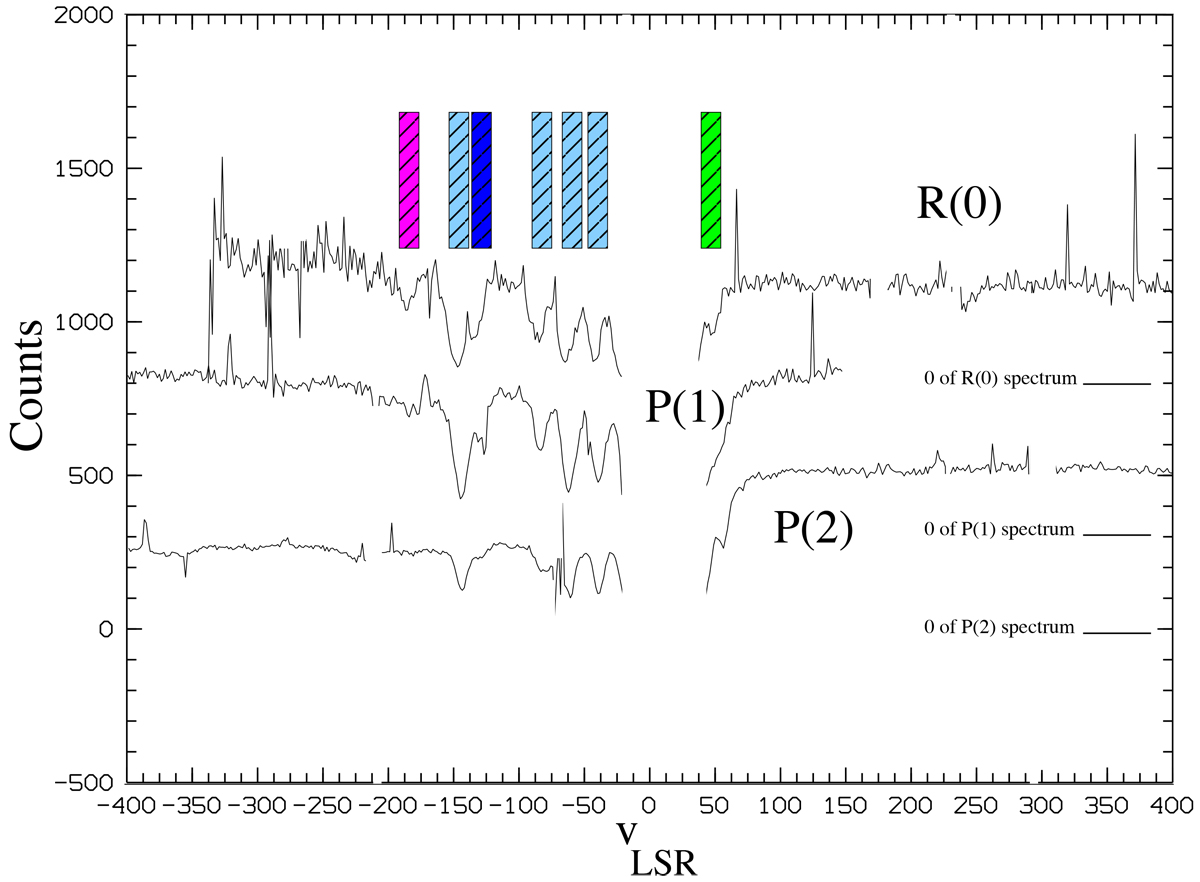
Spectra of the 12CO R(0), P(1), and P(2) transition lines resulting from the addition of all the observed IR source spectra. The light blue rectangles show the positions of the lines at vLSR ~ − 40, −60, −85, and − 145km s−1 present in all the spectra and that we attribute to foreground clouds. The magenta, blue, and green rectangles show the positions of the lines at velocities vLSR ~ −185, −130, and +50 kms−1, respectively. They are present in two of the transition line spectra (R(0) and P(1) in the case of the lines at vLSR ~ −130 and −185 km s−1, and R(0) and P(2) in the case of the line at vLSR ~ 50 km s−1).
Current usage metrics show cumulative count of Article Views (full-text article views including HTML views, PDF and ePub downloads, according to the available data) and Abstracts Views on Vision4Press platform.
Data correspond to usage on the plateform after 2015. The current usage metrics is available 48-96 hours after online publication and is updated daily on week days.
Initial download of the metrics may take a while.