Open Access
Fig. 2
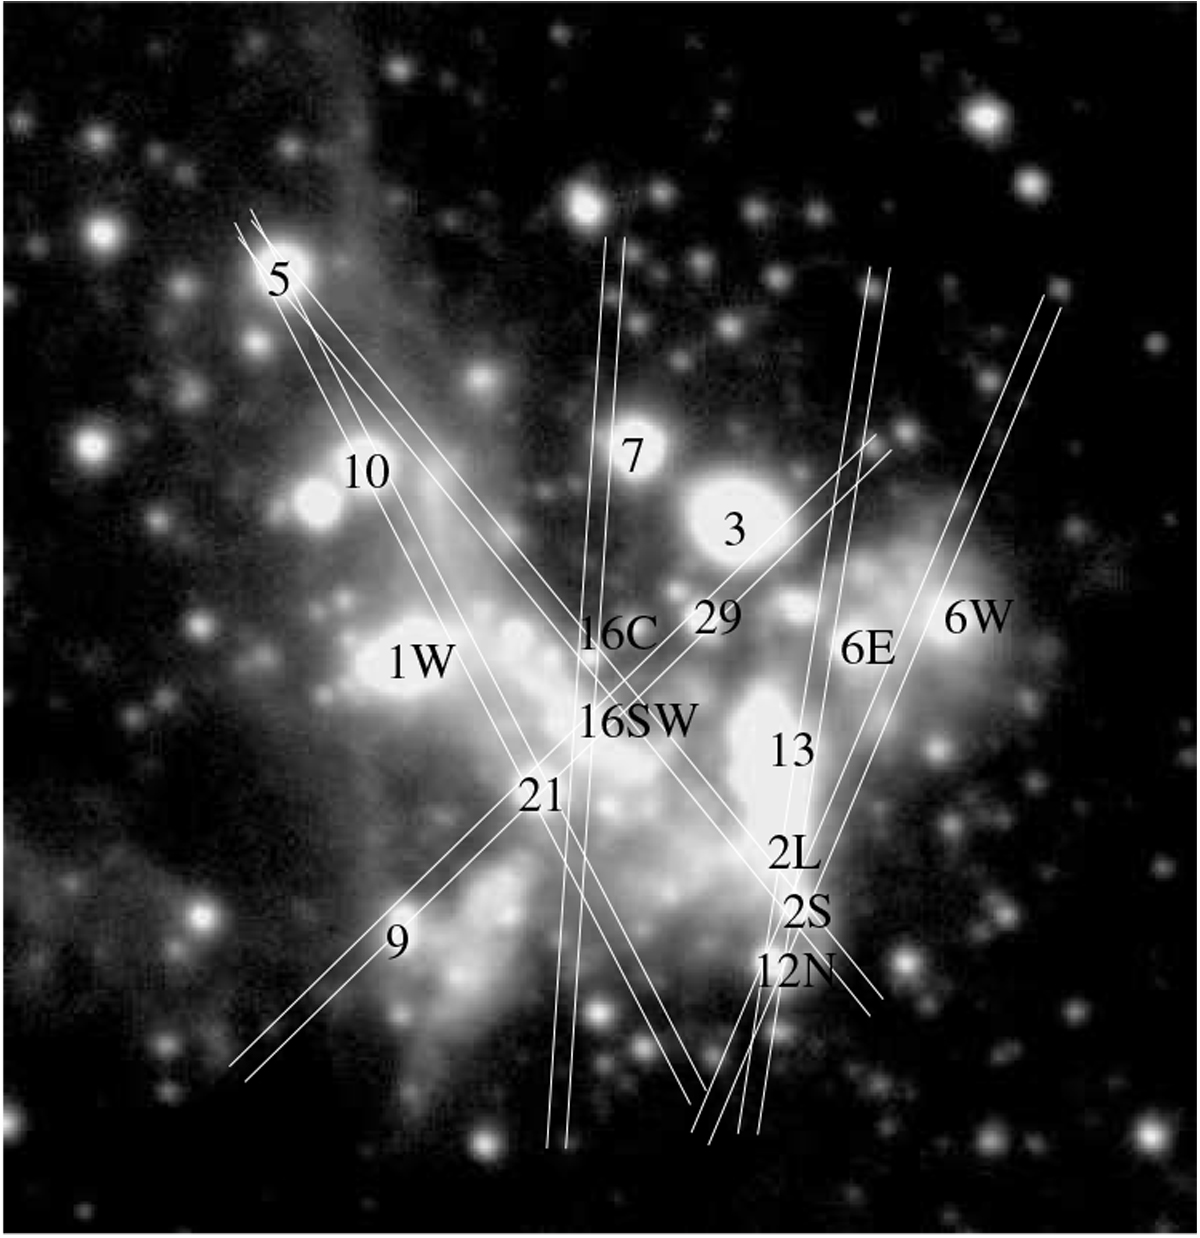
Positions of the 0.4′′ slits used during the observing run. They cover the 13 observed sources listed in Table 1. The IRS numbers of the main bright sources of the central cluster are also indicated.
Current usage metrics show cumulative count of Article Views (full-text article views including HTML views, PDF and ePub downloads, according to the available data) and Abstracts Views on Vision4Press platform.
Data correspond to usage on the plateform after 2015. The current usage metrics is available 48-96 hours after online publication and is updated daily on week days.
Initial download of the metrics may take a while.