Free Access
Fig. 9.
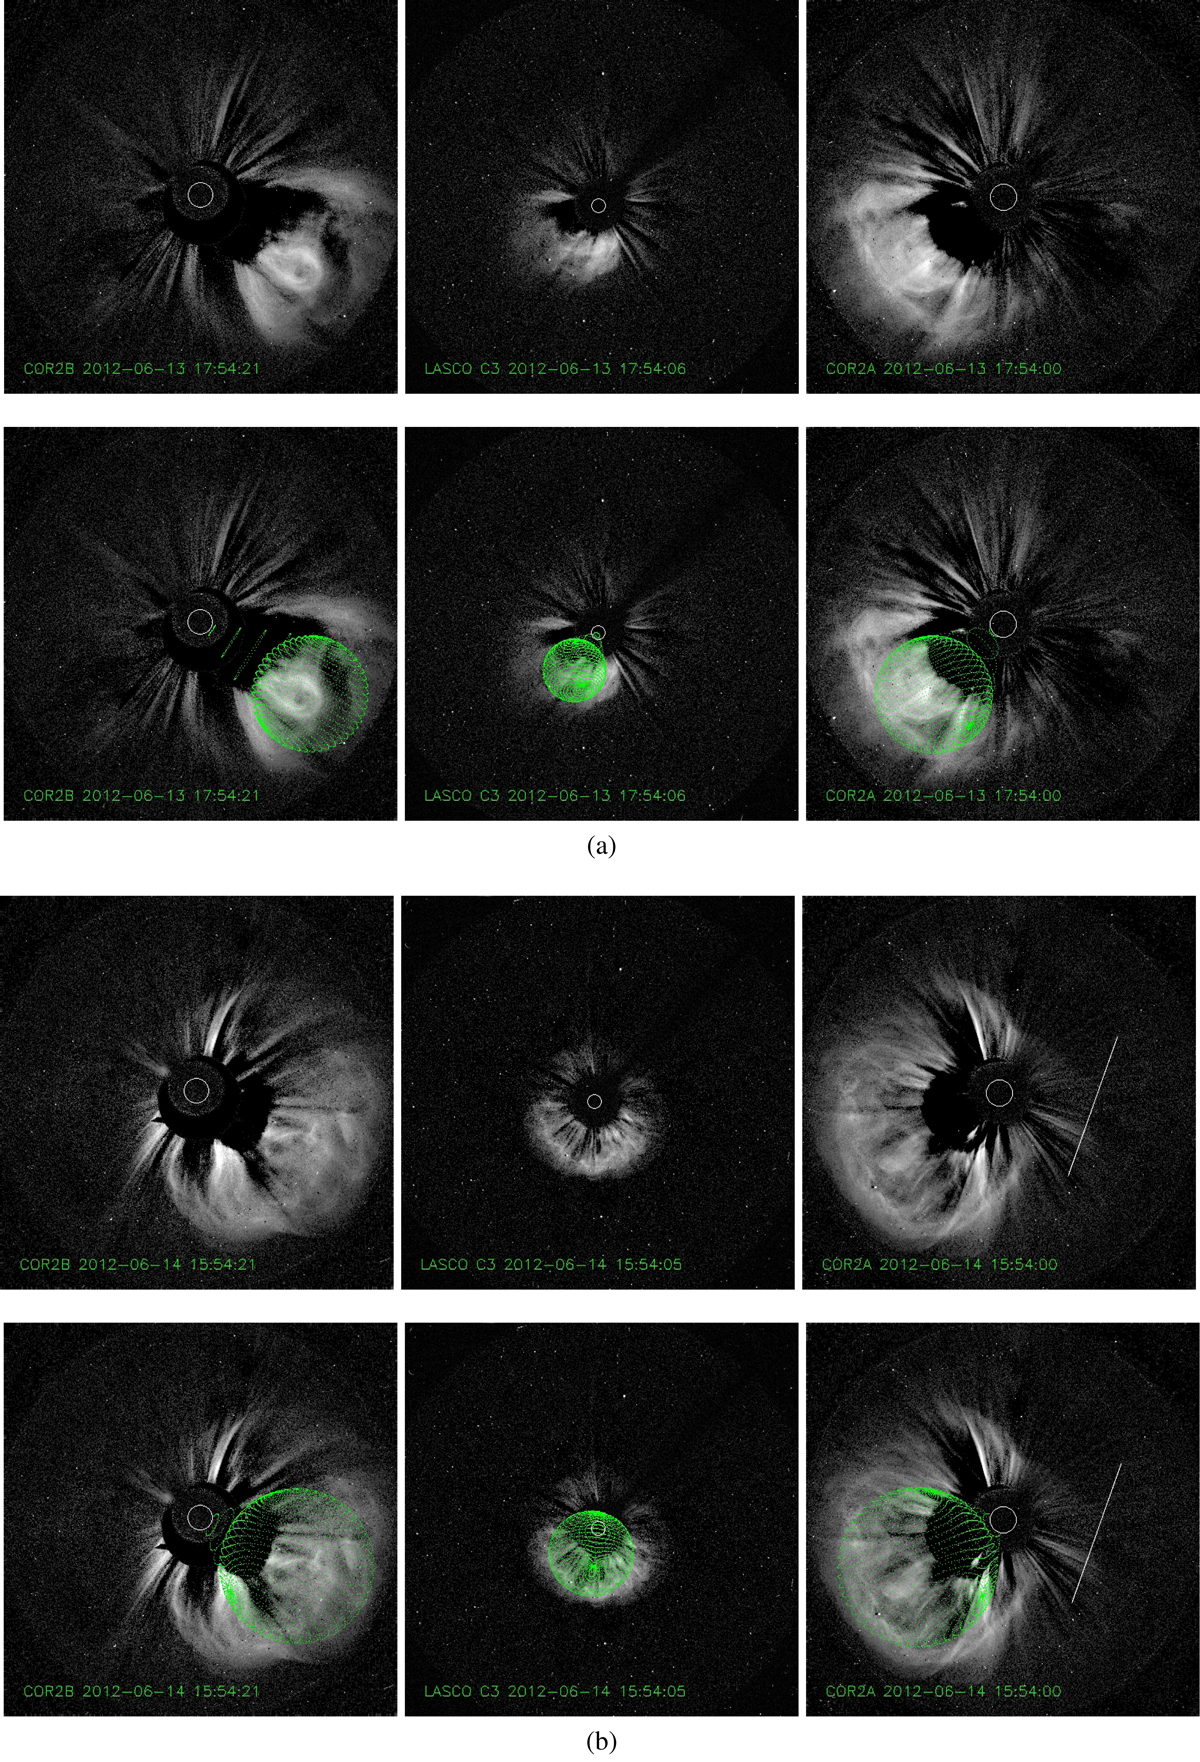
Event 2: GCS fitting of CME1 (a) and CME2 (b). SECCHI/COR2B (left column), LASCO C3 (central column), and SECCHI/COR2A (left column) pre-event background-subtracted intensity images of the two CME events with and without the GCS model wireframe (in green).
Current usage metrics show cumulative count of Article Views (full-text article views including HTML views, PDF and ePub downloads, according to the available data) and Abstracts Views on Vision4Press platform.
Data correspond to usage on the plateform after 2015. The current usage metrics is available 48-96 hours after online publication and is updated daily on week days.
Initial download of the metrics may take a while.