Fig. 7.
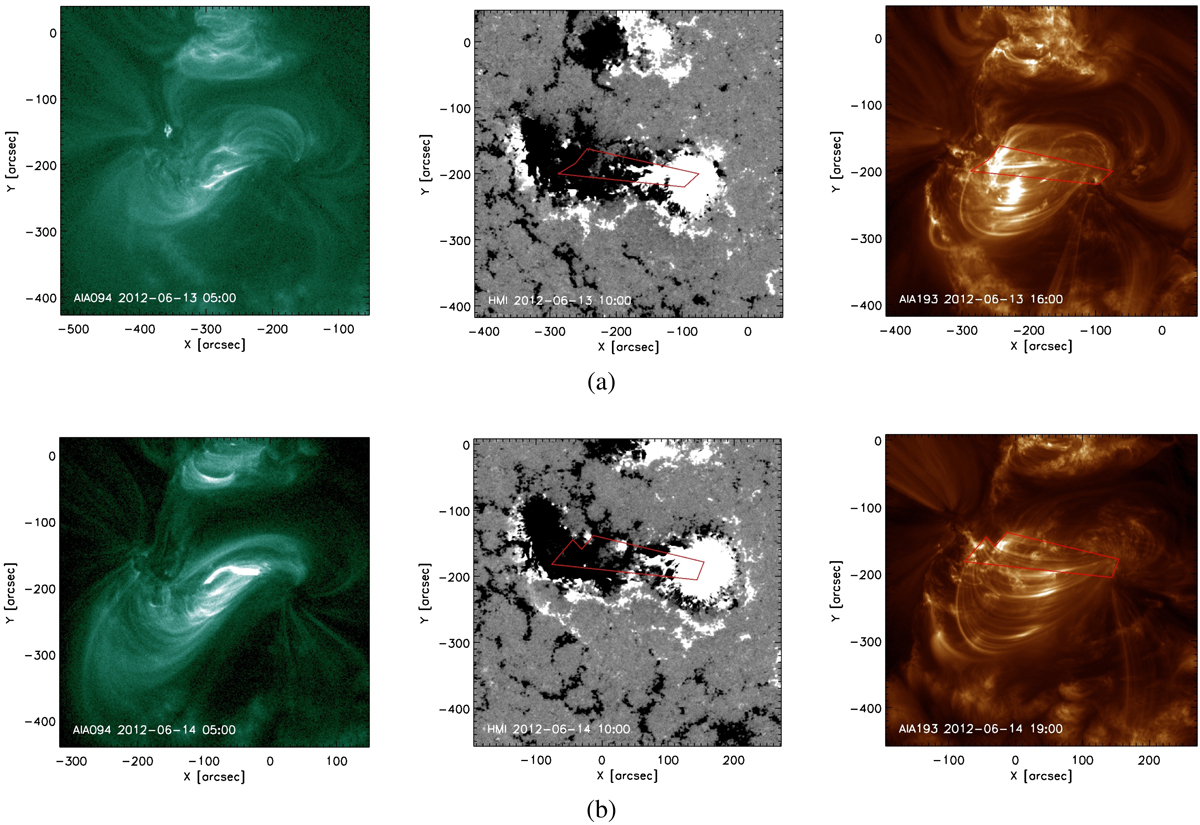
Event 2: AR 11504 on 13 June 2012 (a) and 14 June 2012 (b). Left: AIA 94 Å image of the pre-eruptive sigmoids. Centre: HMI magnetogram with PEA areas overlaid (saturated at −100 gauss and +100 gauss). Right: PEAs from AIA 193 Å with the area outlined by a polygon. The dates and times are shown as YYYY-MM-DD hh:mm in all panels.
Current usage metrics show cumulative count of Article Views (full-text article views including HTML views, PDF and ePub downloads, according to the available data) and Abstracts Views on Vision4Press platform.
Data correspond to usage on the plateform after 2015. The current usage metrics is available 48-96 hours after online publication and is updated daily on week days.
Initial download of the metrics may take a while.