Fig. 6.
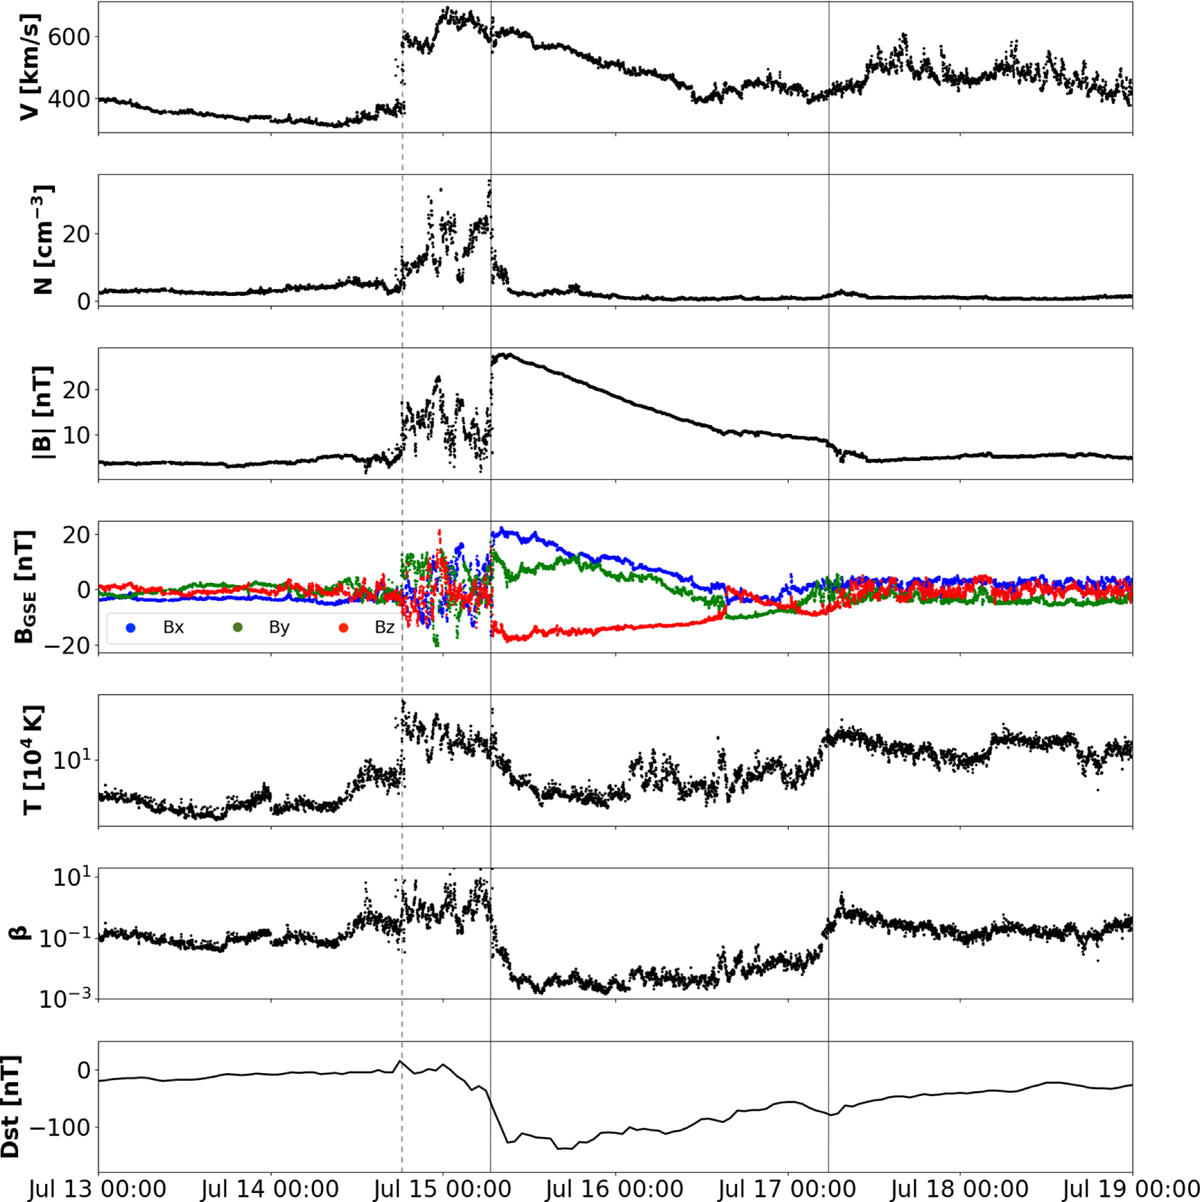
Event 1: In situ observations for the 12 July 2012 event from OMNI 1 min data. From top to bottom: speed, number density, magnetic field strength, Bx, By, Bz components in GSE coordinates, temperature, plasma β, and Dst index. The vertical dashed black line marks the interplanetary shock associated to the ICME, whilst the region delimited by the continuous black lines marks the MC period.
Current usage metrics show cumulative count of Article Views (full-text article views including HTML views, PDF and ePub downloads, according to the available data) and Abstracts Views on Vision4Press platform.
Data correspond to usage on the plateform after 2015. The current usage metrics is available 48-96 hours after online publication and is updated daily on week days.
Initial download of the metrics may take a while.