Fig. 14.
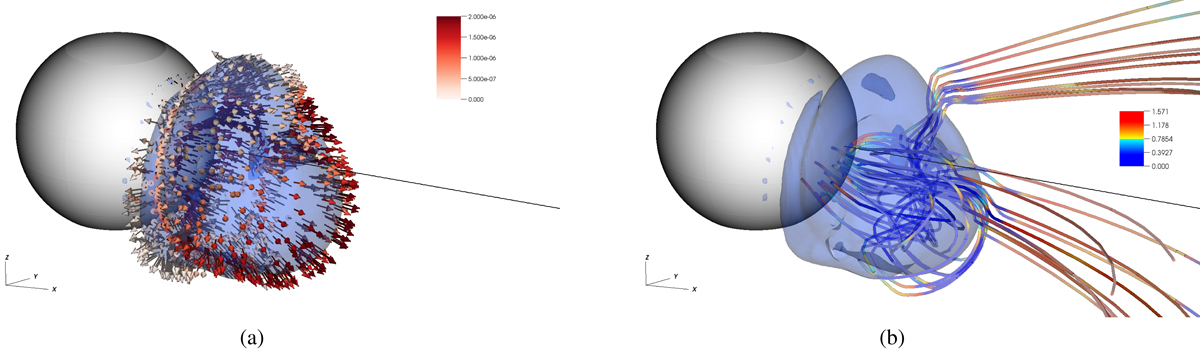
Event 1: visualisation of the forces acting on the CME in Run 03 on 13 July 2012 at 03:53 UT, when the CME leading edge was close to 0.3 AU. Panel a: arrows indicating the direction of the Lorentz force ![]() at the β = 0.5 surface. The arrows colour code is based on the magnitude of the Lorentz force (in Pa AU−1). Panel b: magnetic field lines in the CME, coloured based on the angle between the current density j and the magnetic field B (in rad, colour scale between 0 an π/4). The blue 3D surface marks the contour of the β = 0.5 surface. The black line indicates the direction to Earth. The spherical 3D surface represents the heliospheric inner boundary at 0.1 AU.
at the β = 0.5 surface. The arrows colour code is based on the magnitude of the Lorentz force (in Pa AU−1). Panel b: magnetic field lines in the CME, coloured based on the angle between the current density j and the magnetic field B (in rad, colour scale between 0 an π/4). The blue 3D surface marks the contour of the β = 0.5 surface. The black line indicates the direction to Earth. The spherical 3D surface represents the heliospheric inner boundary at 0.1 AU.
Current usage metrics show cumulative count of Article Views (full-text article views including HTML views, PDF and ePub downloads, according to the available data) and Abstracts Views on Vision4Press platform.
Data correspond to usage on the plateform after 2015. The current usage metrics is available 48-96 hours after online publication and is updated daily on week days.
Initial download of the metrics may take a while.