Fig. 6.
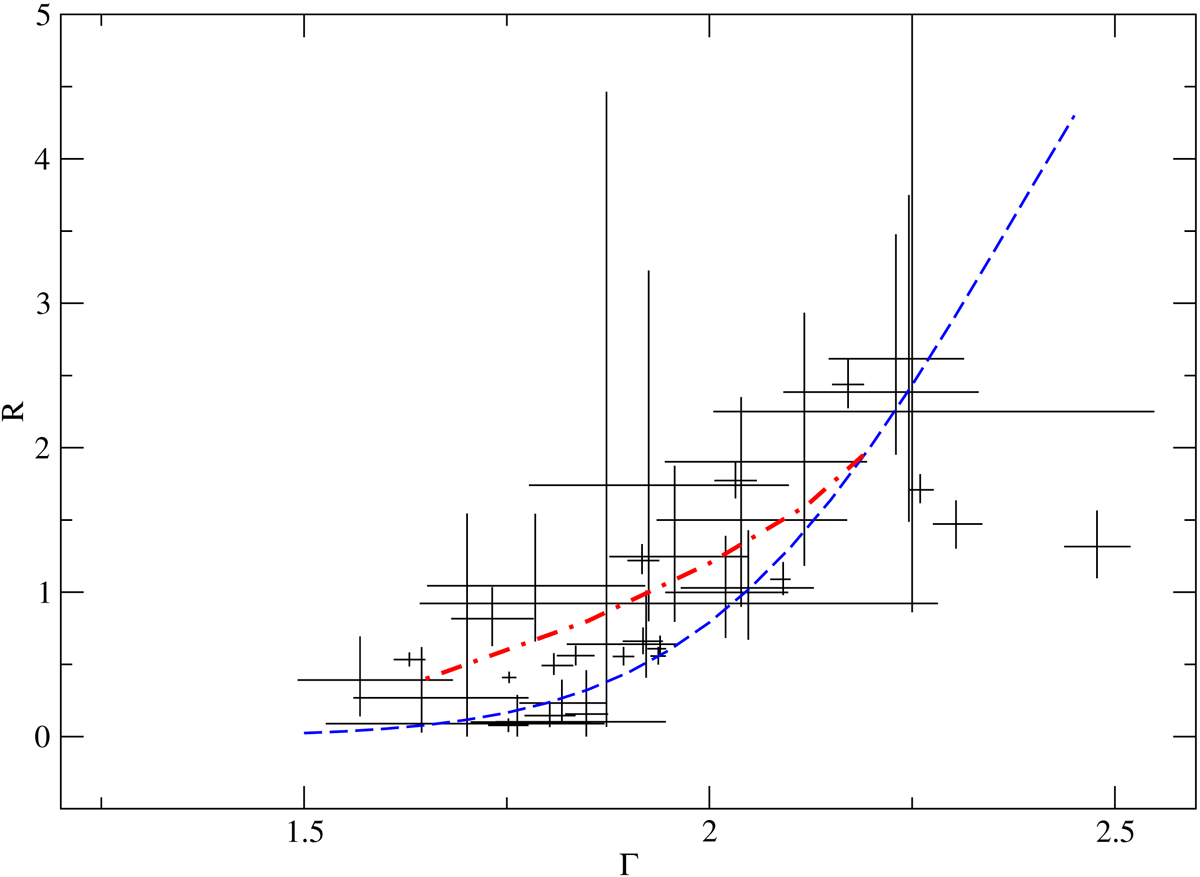
Correlation between reflection and photon index in unabsorbed sources (Classes 1 and 2). The blue dashed line indicates the correlation expected as a result of the relative motion of the corona with respect to the disc (Beloborodov 1999). The red dot-dashed line represents the correlation expected when the covering factor of the disc is variable.
Current usage metrics show cumulative count of Article Views (full-text article views including HTML views, PDF and ePub downloads, according to the available data) and Abstracts Views on Vision4Press platform.
Data correspond to usage on the plateform after 2015. The current usage metrics is available 48-96 hours after online publication and is updated daily on week days.
Initial download of the metrics may take a while.