Fig. 5.
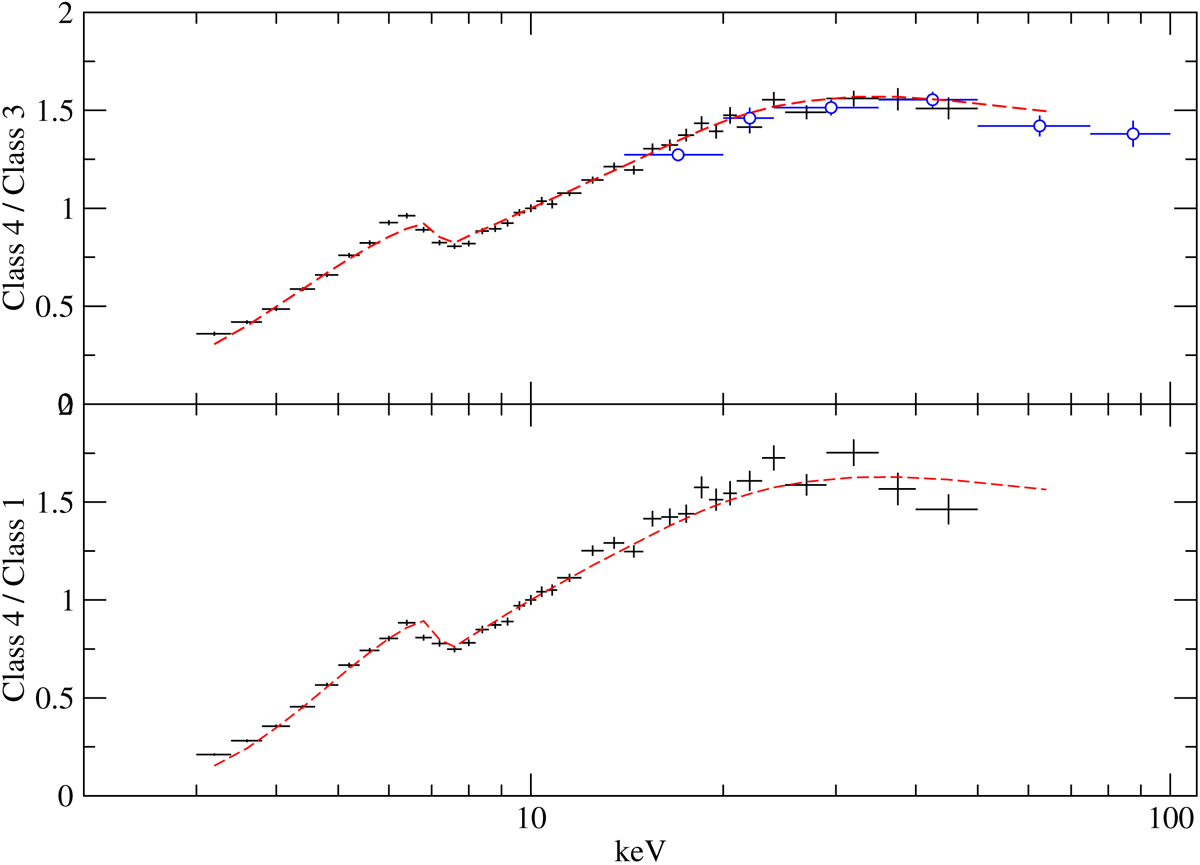
Ratio of Class 4 spectrum to Class 3 (upper panel) and Class 1 (bottom). The blue circles correspond to the ratio of mildly obscured sources over lightly obscured objects using BAT stacked data (Esposito & Walter 2016). The dashed red line denotes the expected ratio between two theoretical spectra that differ only in the reflection and obscuration level.
Current usage metrics show cumulative count of Article Views (full-text article views including HTML views, PDF and ePub downloads, according to the available data) and Abstracts Views on Vision4Press platform.
Data correspond to usage on the plateform after 2015. The current usage metrics is available 48-96 hours after online publication and is updated daily on week days.
Initial download of the metrics may take a while.