Fig. 4.
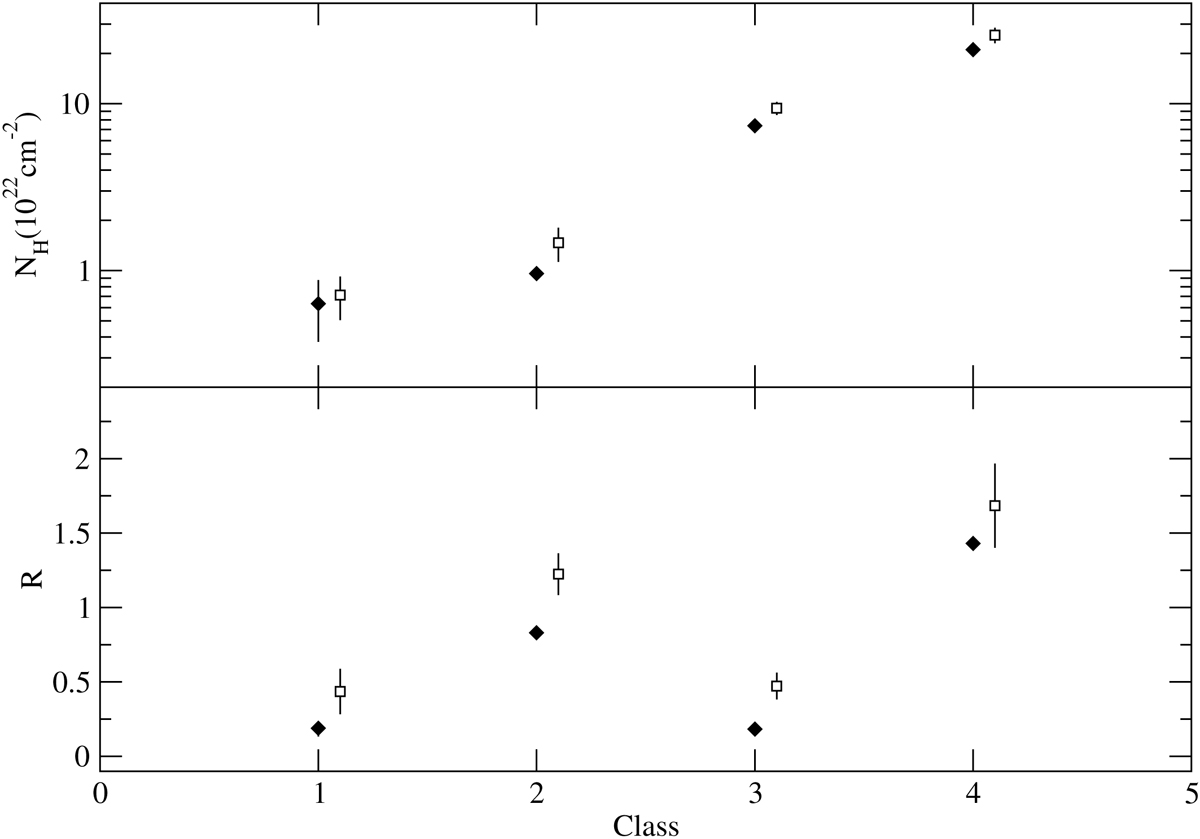
Best-fit absorption column density (upper) and reflection strength (lower panel) for the different classes. The filled diamonds correspond to the values acquired when we fitted the composite spectra, and the open squares show the mean values of the best fits to the individual spectra. The arbitrary offset along the x-axis is to improve clarity.
Current usage metrics show cumulative count of Article Views (full-text article views including HTML views, PDF and ePub downloads, according to the available data) and Abstracts Views on Vision4Press platform.
Data correspond to usage on the plateform after 2015. The current usage metrics is available 48-96 hours after online publication and is updated daily on week days.
Initial download of the metrics may take a while.