Free Access
Fig. 3.
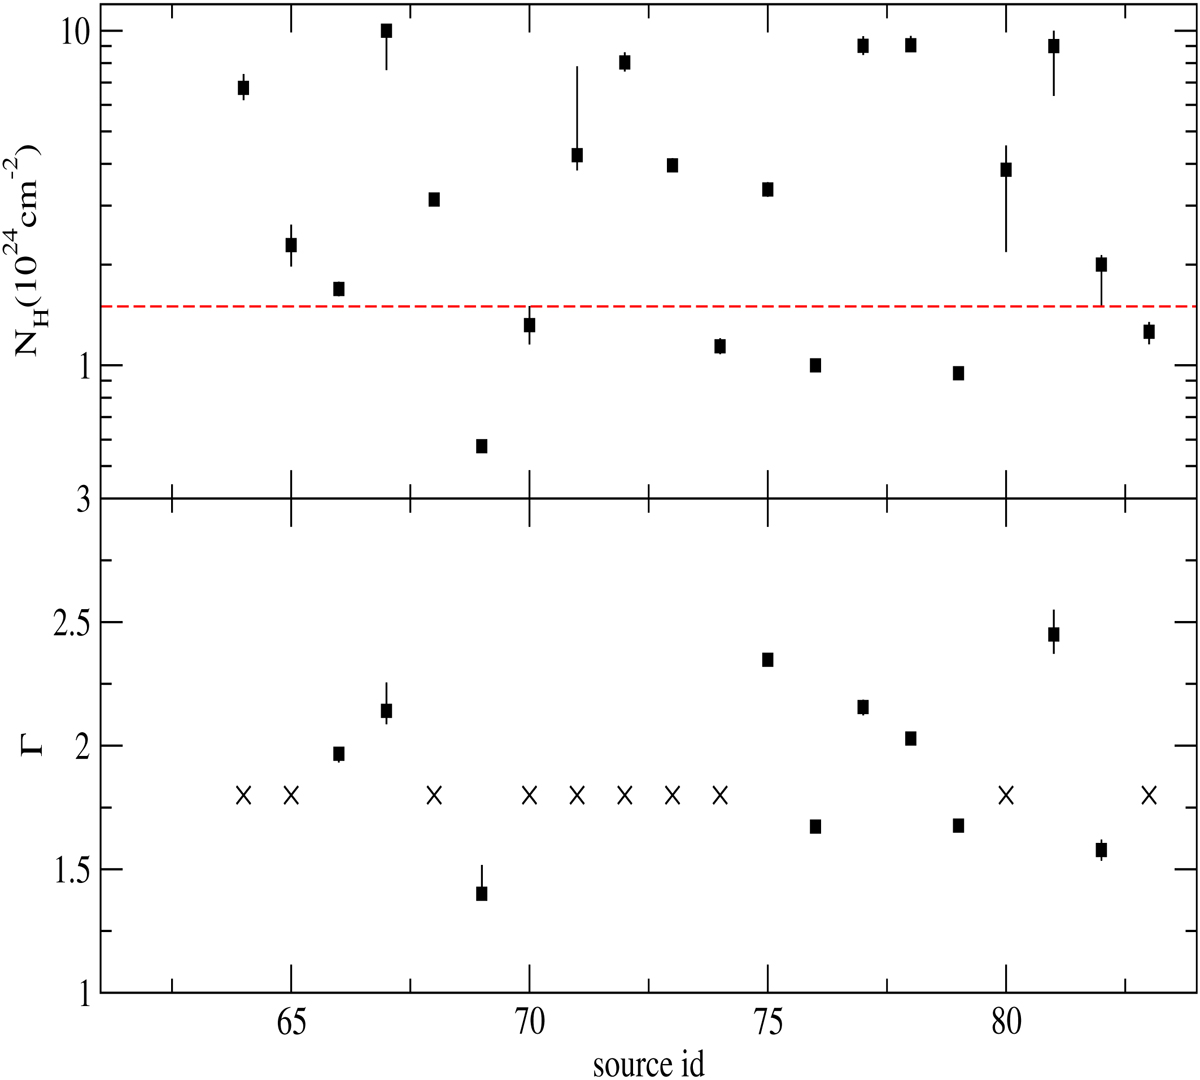
Best-fit values of absorption column density (top) and power-law slope (bottom panel) for the reflection-dominated objects (Class 5). The red dashed line in the top panel denotes the boundary (NH = 1.5 × 1024 cm−2) between CT and Compton-thin sources.
Current usage metrics show cumulative count of Article Views (full-text article views including HTML views, PDF and ePub downloads, according to the available data) and Abstracts Views on Vision4Press platform.
Data correspond to usage on the plateform after 2015. The current usage metrics is available 48-96 hours after online publication and is updated daily on week days.
Initial download of the metrics may take a while.