Fig. 2.
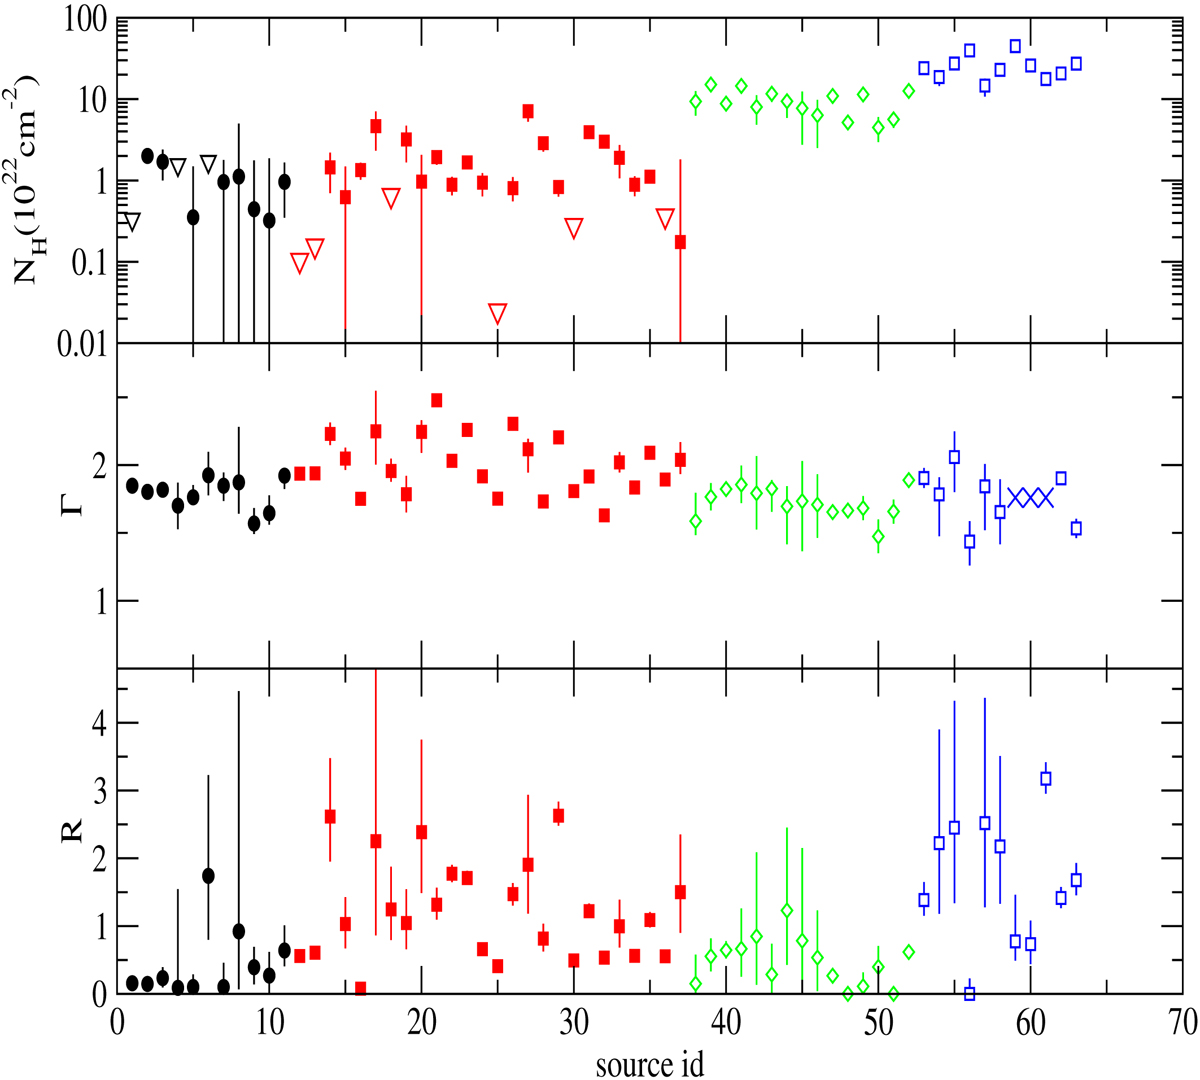
Best-fit values of absorption column density (top), power-law slope (middle), and reflection strength (bottom panel). Class 1 objects are denoted by filled black circles and Class 2 objects by filled red squares. The open green diamonds indicate Class 3 sources and the open blue squares correspond to Class 4 objects. The open downward triangles in the top panel denote the 1σ upper limits of these values. The crosses in the middle panel denote the sources that were fitted with a fixed Γ value (see text for details).
Current usage metrics show cumulative count of Article Views (full-text article views including HTML views, PDF and ePub downloads, according to the available data) and Abstracts Views on Vision4Press platform.
Data correspond to usage on the plateform after 2015. The current usage metrics is available 48-96 hours after online publication and is updated daily on week days.
Initial download of the metrics may take a while.