Fig. 3.
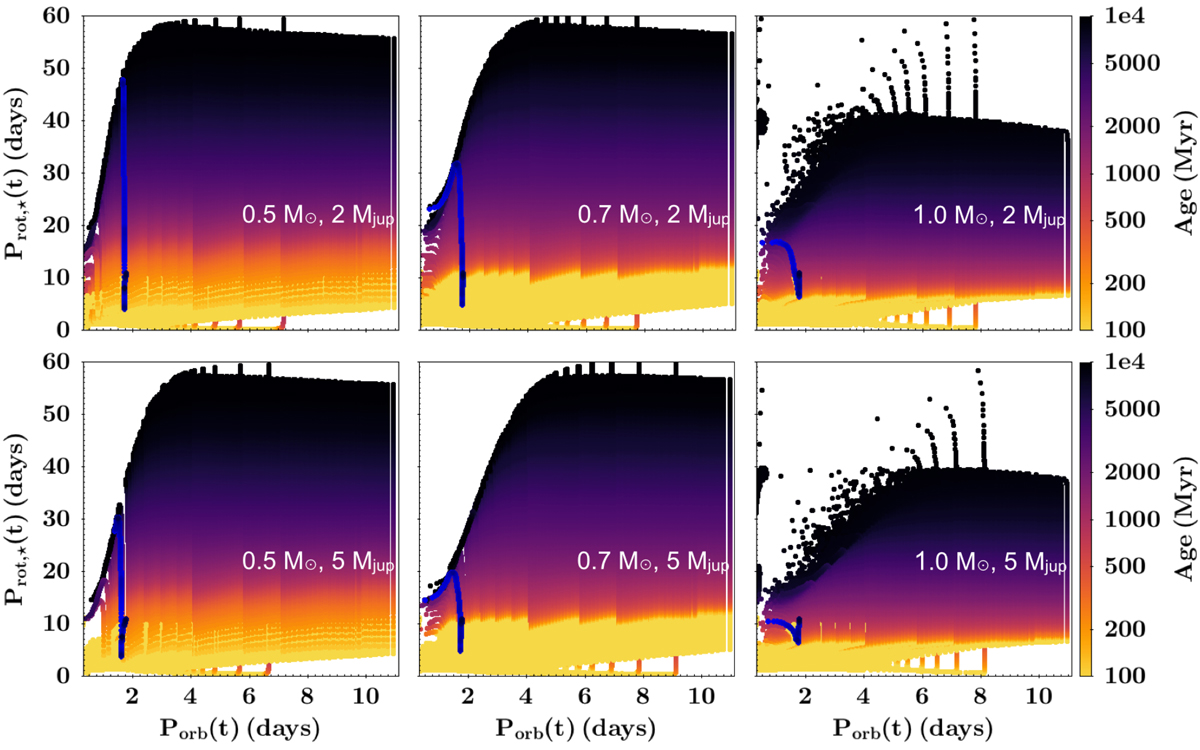
Synthetic Prot, ⋆(t) and Porb(t) estimated for a system composed of a 0.5, 0.7, and 1.0 M⊙ star around which orbits a 2 Mjup planet (upper panel) and a 5 Mjup planet (lower panel). Prot, init = 1−11 days (with ΔProt, init = 0.2 days) and SMAinit is between 0.1 and 1.0 Rco (Gallet et al. 2018). The color gradient indicates the age (in Myr) at which the pair Prot, ⋆(t) − Porb(t) is extracted. Only planetary systems where the planet is still orbiting the star are plotted. The blue lines (composed of plain circles) depict the evolution of a given star-planet system (Prot, init = 10.8 days and SMAinit = 30%Rco) in the Prot, ⋆(t) − Porb(t) plane.
Current usage metrics show cumulative count of Article Views (full-text article views including HTML views, PDF and ePub downloads, according to the available data) and Abstracts Views on Vision4Press platform.
Data correspond to usage on the plateform after 2015. The current usage metrics is available 48-96 hours after online publication and is updated daily on week days.
Initial download of the metrics may take a while.