Fig. 1.
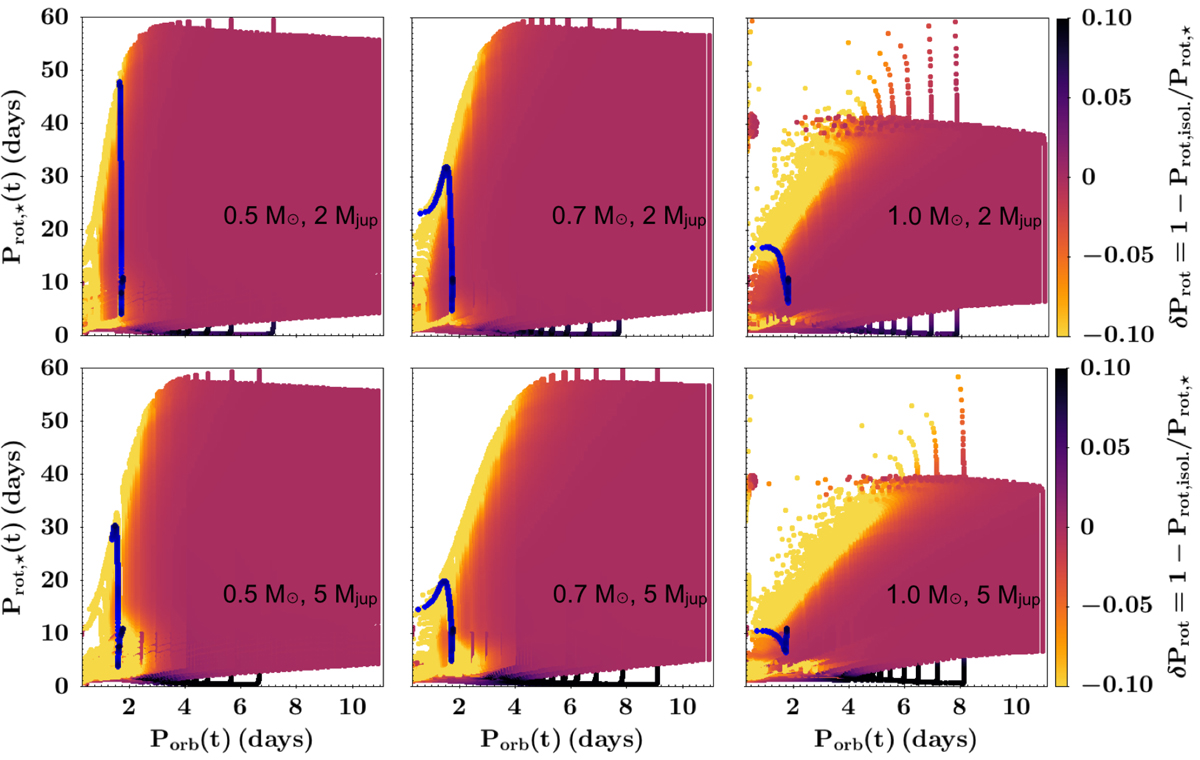
Evolution of Prot, ⋆(t) as a function of Porb(t) and stellar mass for a 2 Mjup (upper panel) and 5 Mjup (lower panel) planet. The color gradient corresponds to the relative rotational departure δProt = 1 − Prot, isol./Prot, ⋆. Only systems where the planet is still present are plotted. The blue lines (composed of plain circles) depict the evolution of a given star-planet system (Prot, init = 10.8 days and SMAinit = 30%Rco) in the Prot, ⋆(t) − Porb(t) plane. The red area shows the domain of applicability of gyrochronology analysis.
Current usage metrics show cumulative count of Article Views (full-text article views including HTML views, PDF and ePub downloads, according to the available data) and Abstracts Views on Vision4Press platform.
Data correspond to usage on the plateform after 2015. The current usage metrics is available 48-96 hours after online publication and is updated daily on week days.
Initial download of the metrics may take a while.