Fig. 8
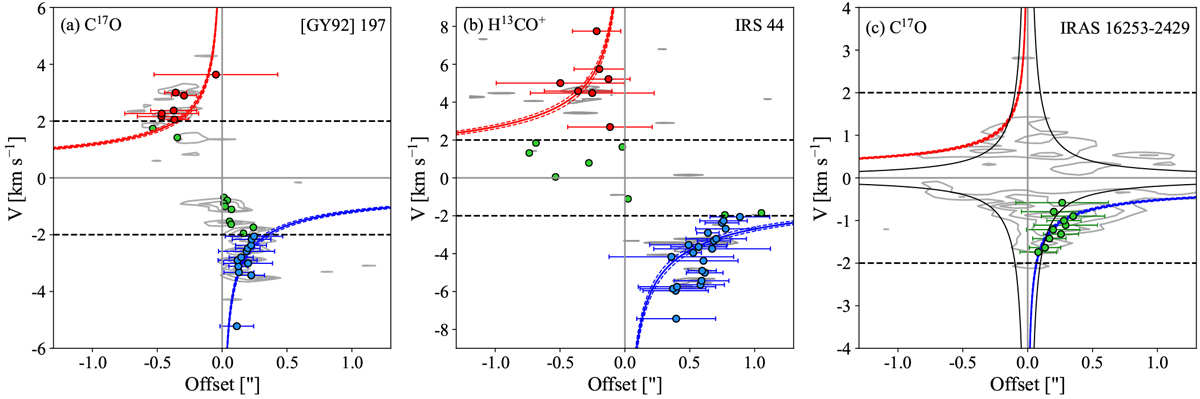
Position-velocity diagrams towards [GY92] 197, IRS 44 and IRAS 16253-2429. Blue and red dots represent blue- and red-shifted emission peaks above ±2 km s−1, respectively, while green dots indicate velocities below ±2 km s−1. Blue and red solid lines show the best fit for a Keplerian velocity profile with their respective errors, shown in dashed blue and red lines. The cut taken from the image data is shown in grey contours, ranging from 3σ (σ = 13 mJy beam−1) to the maximum value of each transition. Each adjacent contour represents an increment of 30% of the maximum value for panels a and c, and an increment of 50% for panel b. The black dashed lines indicate the velocity above which the Keplerian profile was fitted. The solid black curves in panel c show the best fit for an infalling velocity profile.
Current usage metrics show cumulative count of Article Views (full-text article views including HTML views, PDF and ePub downloads, according to the available data) and Abstracts Views on Vision4Press platform.
Data correspond to usage on the plateform after 2015. The current usage metrics is available 48-96 hours after online publication and is updated daily on week days.
Initial download of the metrics may take a while.