Free Access
Fig. 5
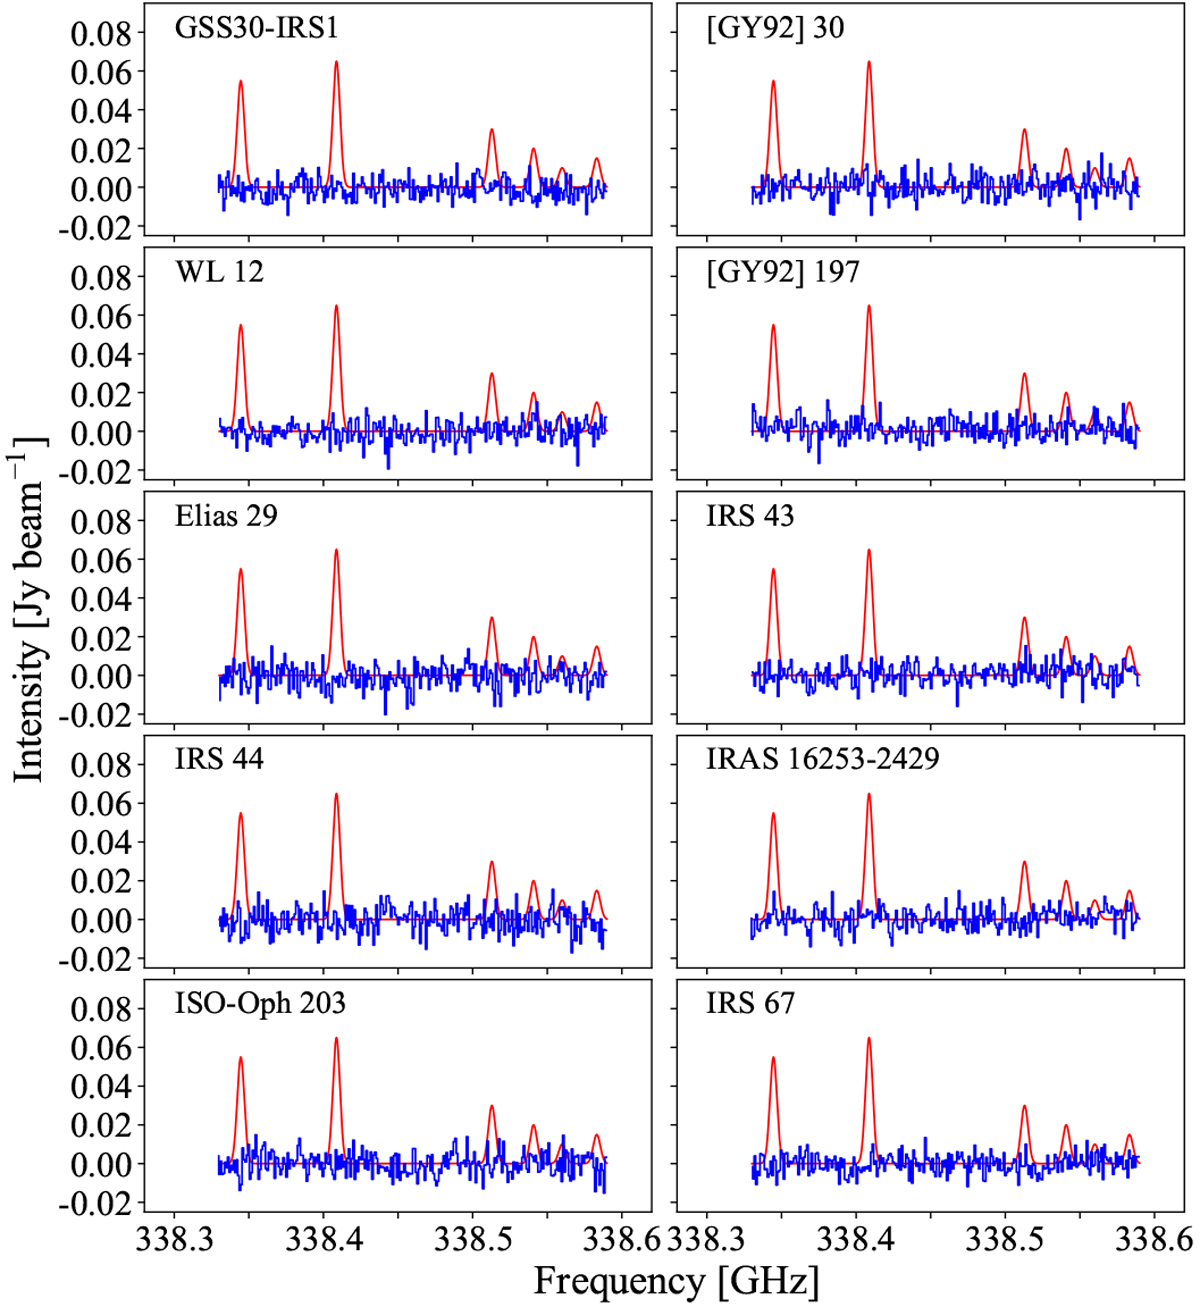
Observed CH3OH spectra (blue) towards the 10 sources that show continuum emission, superimposed on the predicted CH3OH spectrum (red) for a column density of 2.5 × 1015 cm−2, ~4 orders of magnitude below the value from the Class 0 source IRAS 16293-2422 (Jørgensen et al. 2016).
Current usage metrics show cumulative count of Article Views (full-text article views including HTML views, PDF and ePub downloads, according to the available data) and Abstracts Views on Vision4Press platform.
Data correspond to usage on the plateform after 2015. The current usage metrics is available 48-96 hours after online publication and is updated daily on week days.
Initial download of the metrics may take a while.