Fig. 2
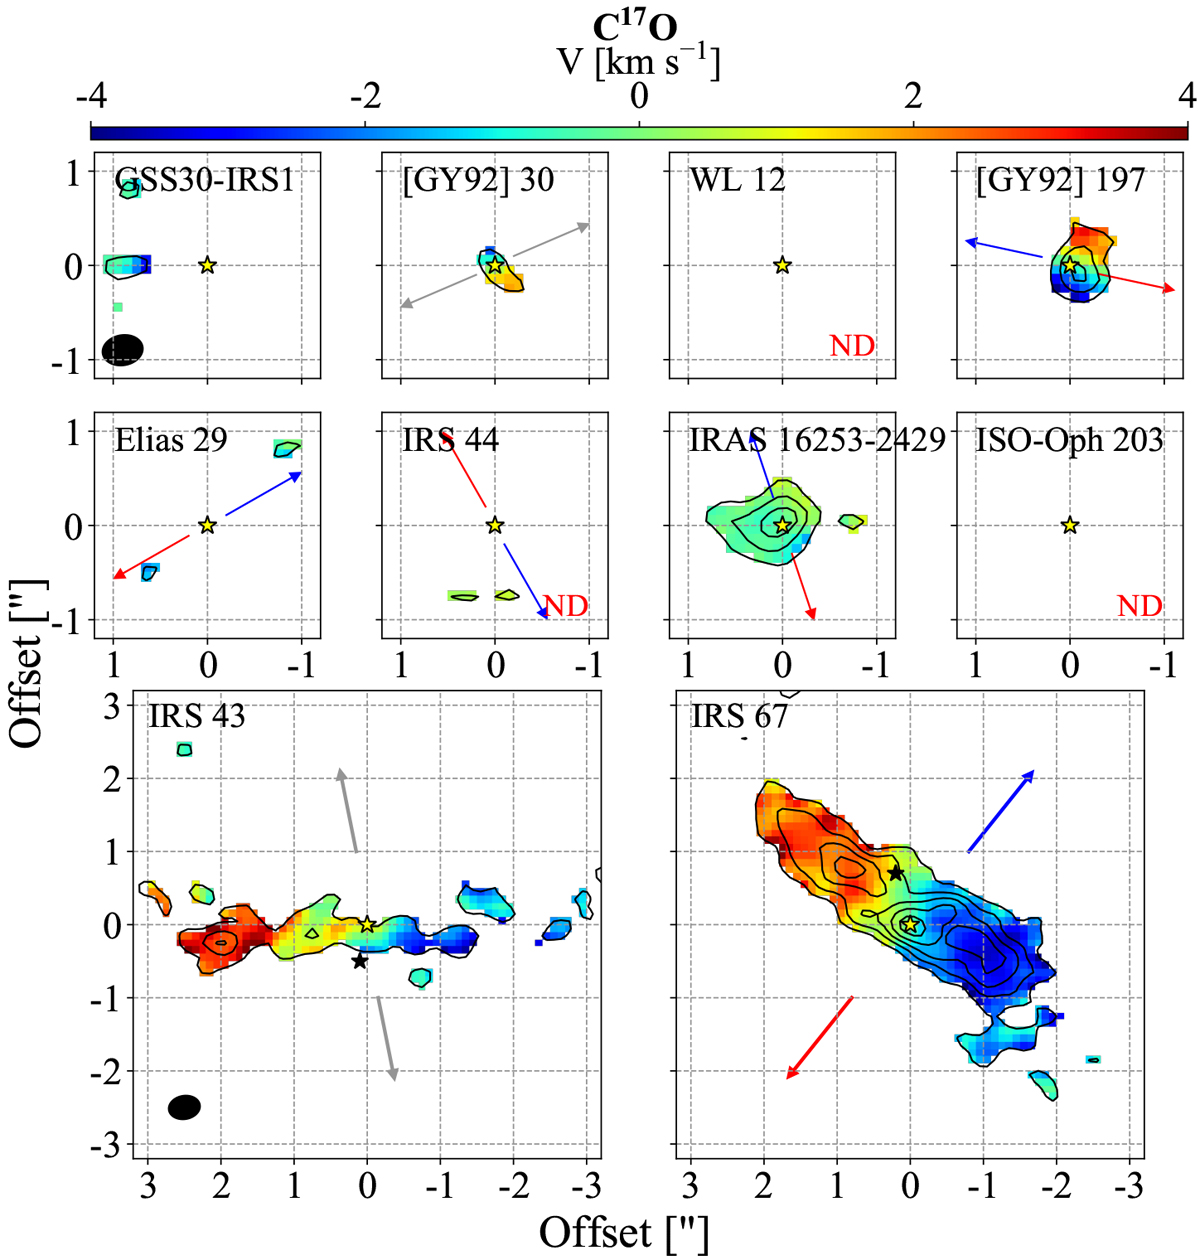
Moment 0 (black contours) and moment 1 (colour scale) maps for C17O J = 3–2 above 5σ and integrated over a velocity range of 8 km s−1. The contours start at 5σ and follow a step of 4σ (σ = 4 mJy beam−1 km s−1). The yellow star indicates the position from a 2D Gaussian fit, and the black stars in the lower panels represent the position of the binary components. The arrows show the outflow direction from the literature, where the blue and red represent blue- and red-shifted emission, respectively, and the grey arrow represents infrared observations. The typical synthesised beam is shown by the black filled ellipse in the upper and lower left panels. The ND label marks a non-detection.
Current usage metrics show cumulative count of Article Views (full-text article views including HTML views, PDF and ePub downloads, according to the available data) and Abstracts Views on Vision4Press platform.
Data correspond to usage on the plateform after 2015. The current usage metrics is available 48-96 hours after online publication and is updated daily on week days.
Initial download of the metrics may take a while.