Fig. A.1
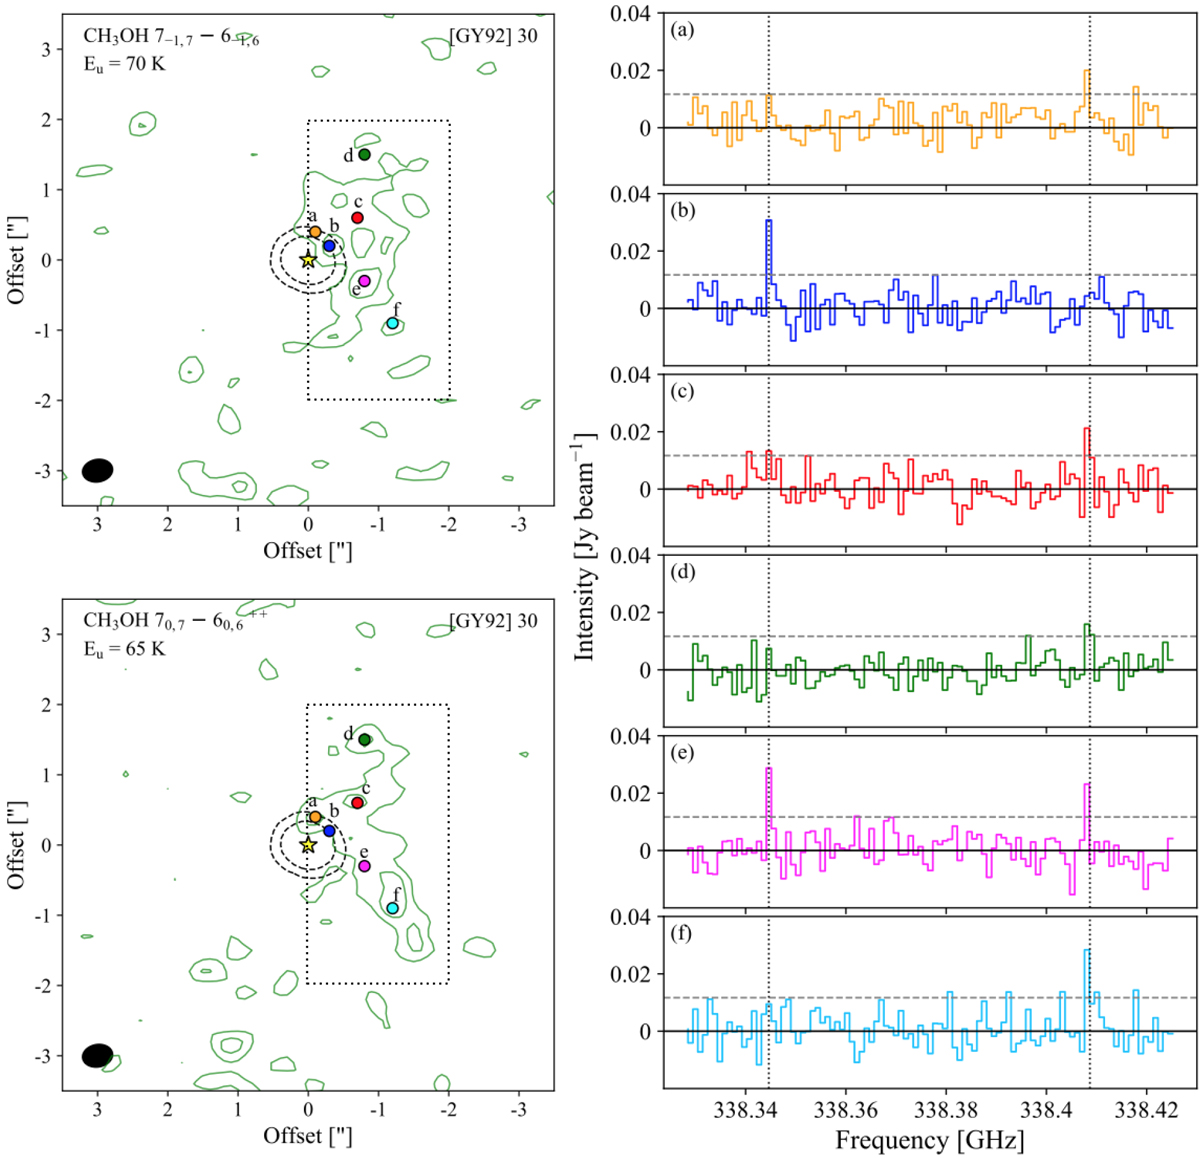
Left: contour maps of CH3OH 7−1 − 6−1 E and CH3OH 70 − 60 A+ towards [GY92] 30. The contours start at 3σ and follow a step of 3σ (σ = 4 mJy beam−1 km s−1), representing velocities from −0.5 to 0.5 km s−1. The dashed black contours show the continuum emission for values of 4 and 25σ. The yellow star indicates the position of the 2D Gaussian fit, and the synthesised beam is represented by the black filled ellipse. The dotted box represents the region from which the spectrum of Fig. A.2 is integrated. Right: spectra towards different positions marked on the contour maps. The grey dashed horizontal line represents a value of 3σ, and all the spectra are rebinned by a factor of 4. The dotted black vertical lines indicate the rest frequency of the two CH3OH transitions.
Current usage metrics show cumulative count of Article Views (full-text article views including HTML views, PDF and ePub downloads, according to the available data) and Abstracts Views on Vision4Press platform.
Data correspond to usage on the plateform after 2015. The current usage metrics is available 48-96 hours after online publication and is updated daily on week days.
Initial download of the metrics may take a while.