Fig. 13
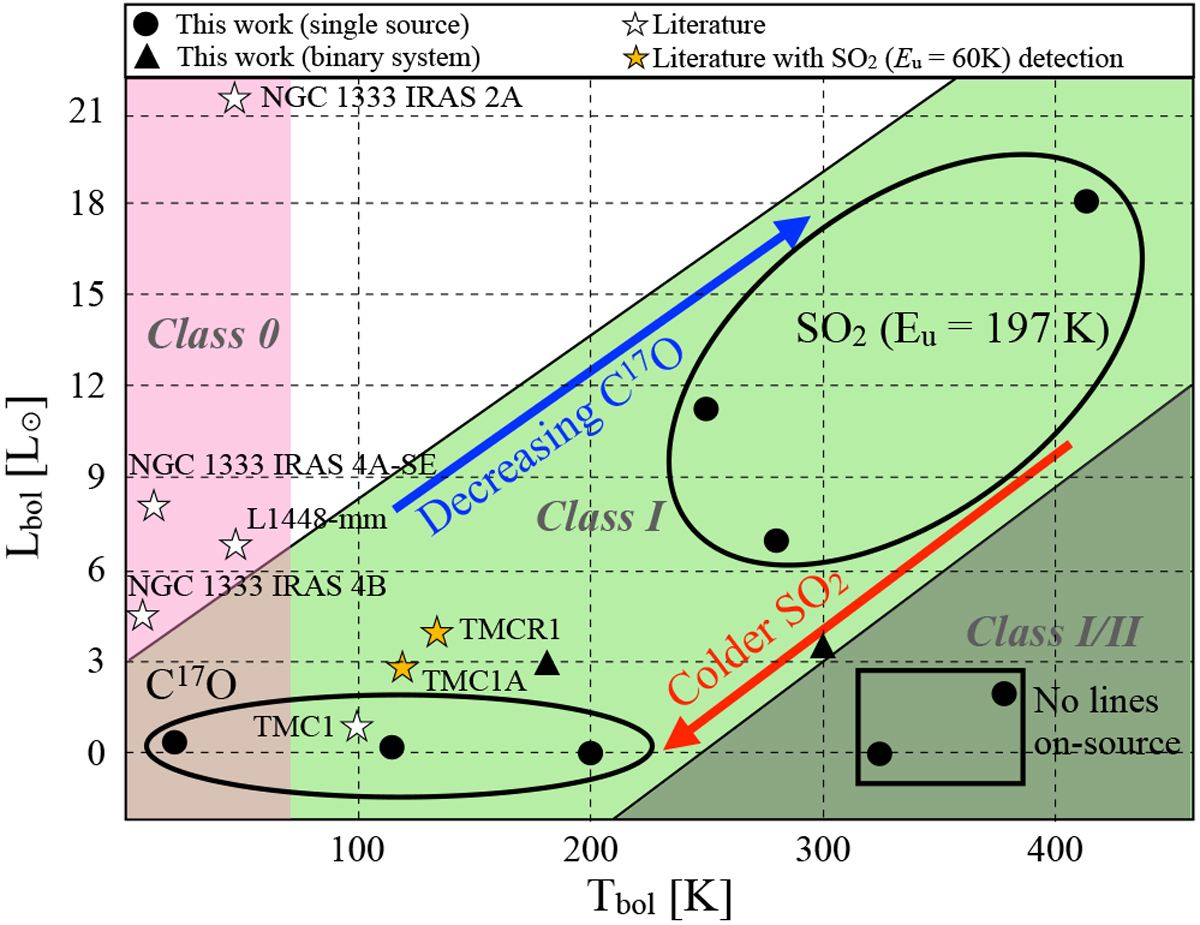
Bolometric luminosity as a function of the bolometric temperature, highlighting the regions where specific molecular transitions are detected towards the source position, and well-known Class 0 and I sources from Dunham et al. (2015) and Harsono et al. (2014), respectively. This plot only covers the lines listed in Table 2 plus SO2 111,11 – 100,10 from Harsono et al. (2014). The Class 0 covers Tbol ≤ 70 K (Dunham et al. 2014b), and the Class I/II region includes the sources where no line emission is detected.
Current usage metrics show cumulative count of Article Views (full-text article views including HTML views, PDF and ePub downloads, according to the available data) and Abstracts Views on Vision4Press platform.
Data correspond to usage on the plateform after 2015. The current usage metrics is available 48-96 hours after online publication and is updated daily on week days.
Initial download of the metrics may take a while.