Fig. 1
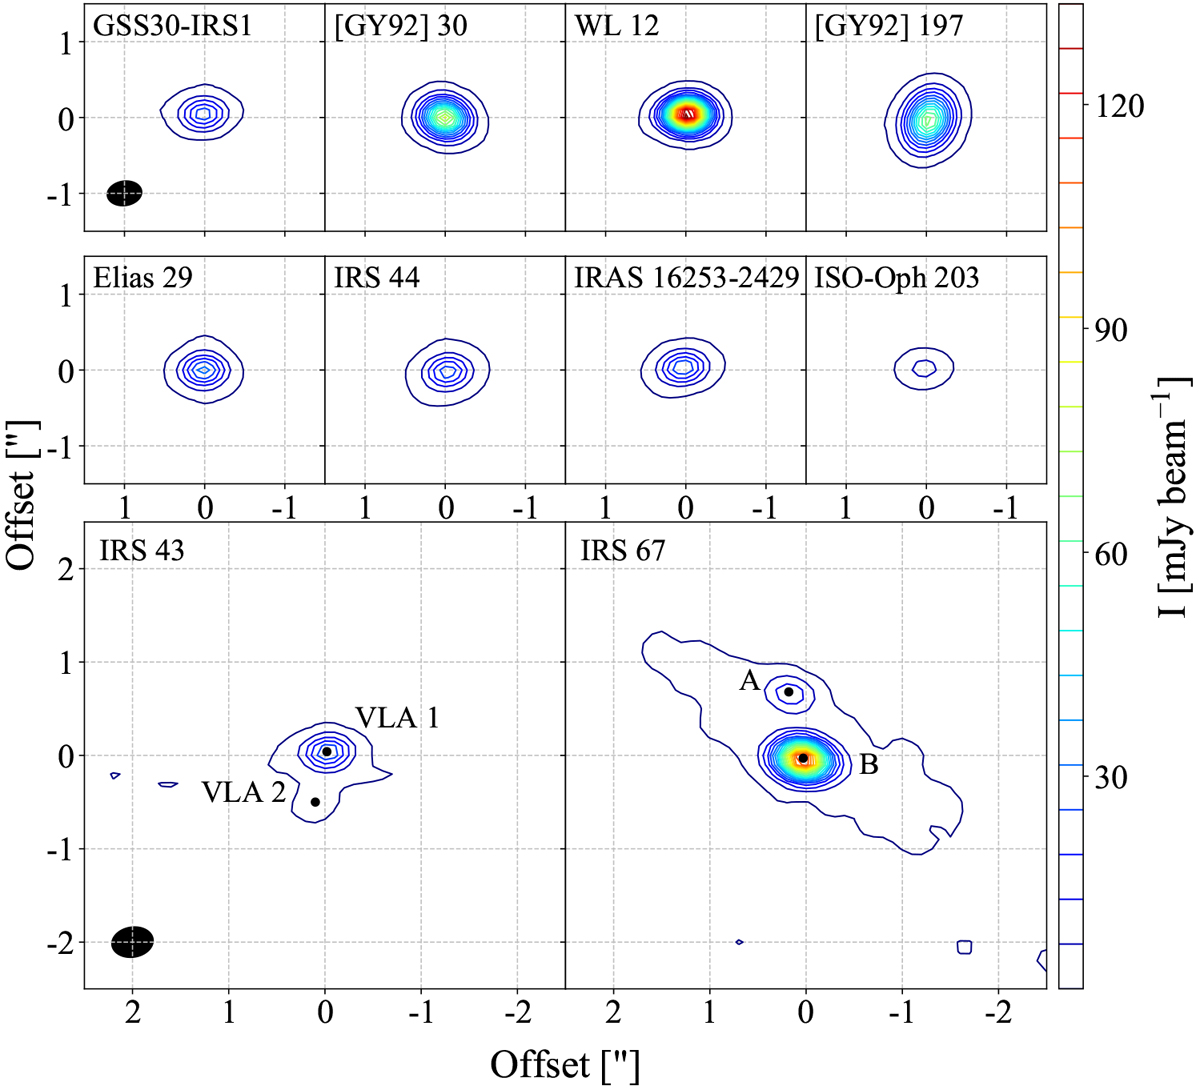
Continuum emission of the detected sources above 5σ (σ = 0.3 mJy beam−1). The contours start at 5σ and follow a step of 20σ. The typical synthesised beam is represented by the black filled ellipse in the upper and lower left panels. The (0,0) position represents the position fitted with a 2D Gaussian (see Table 3). Lower panel: binary systems with the common identifiers of both components.
Current usage metrics show cumulative count of Article Views (full-text article views including HTML views, PDF and ePub downloads, according to the available data) and Abstracts Views on Vision4Press platform.
Data correspond to usage on the plateform after 2015. The current usage metrics is available 48-96 hours after online publication and is updated daily on week days.
Initial download of the metrics may take a while.