Free Access
Fig. 5
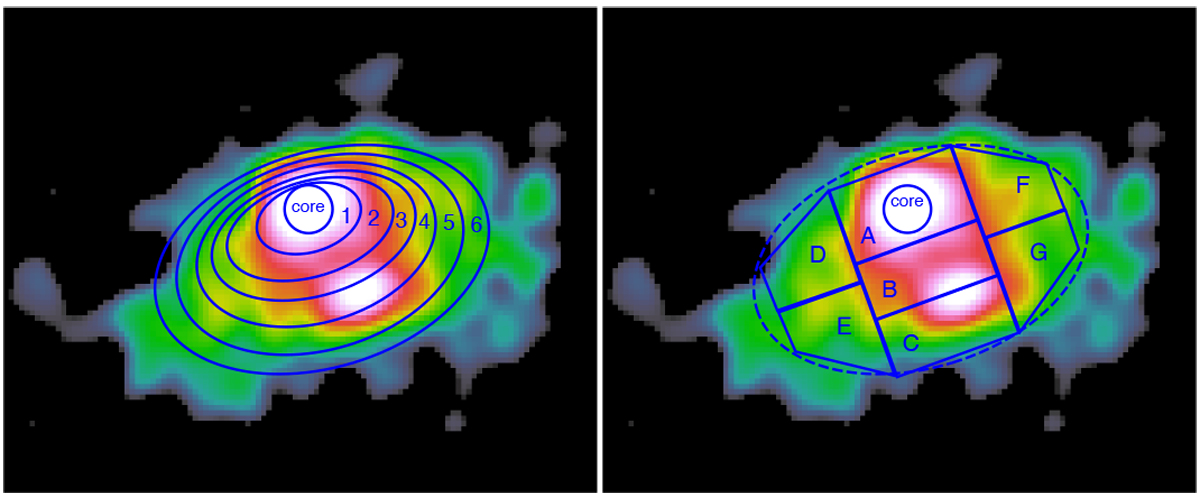
Two sets of extraction regions we used in analyzing the spectral softening of the nebula: elliptical annular regions centered at PS1 (left) and polygonal regions that are symmetrically located with respect to the minor axis of the nebula (right). The background image is the same as the bottom panel of Fig. 2.
Current usage metrics show cumulative count of Article Views (full-text article views including HTML views, PDF and ePub downloads, according to the available data) and Abstracts Views on Vision4Press platform.
Data correspond to usage on the plateform after 2015. The current usage metrics is available 48-96 hours after online publication and is updated daily on week days.
Initial download of the metrics may take a while.