Fig. 12
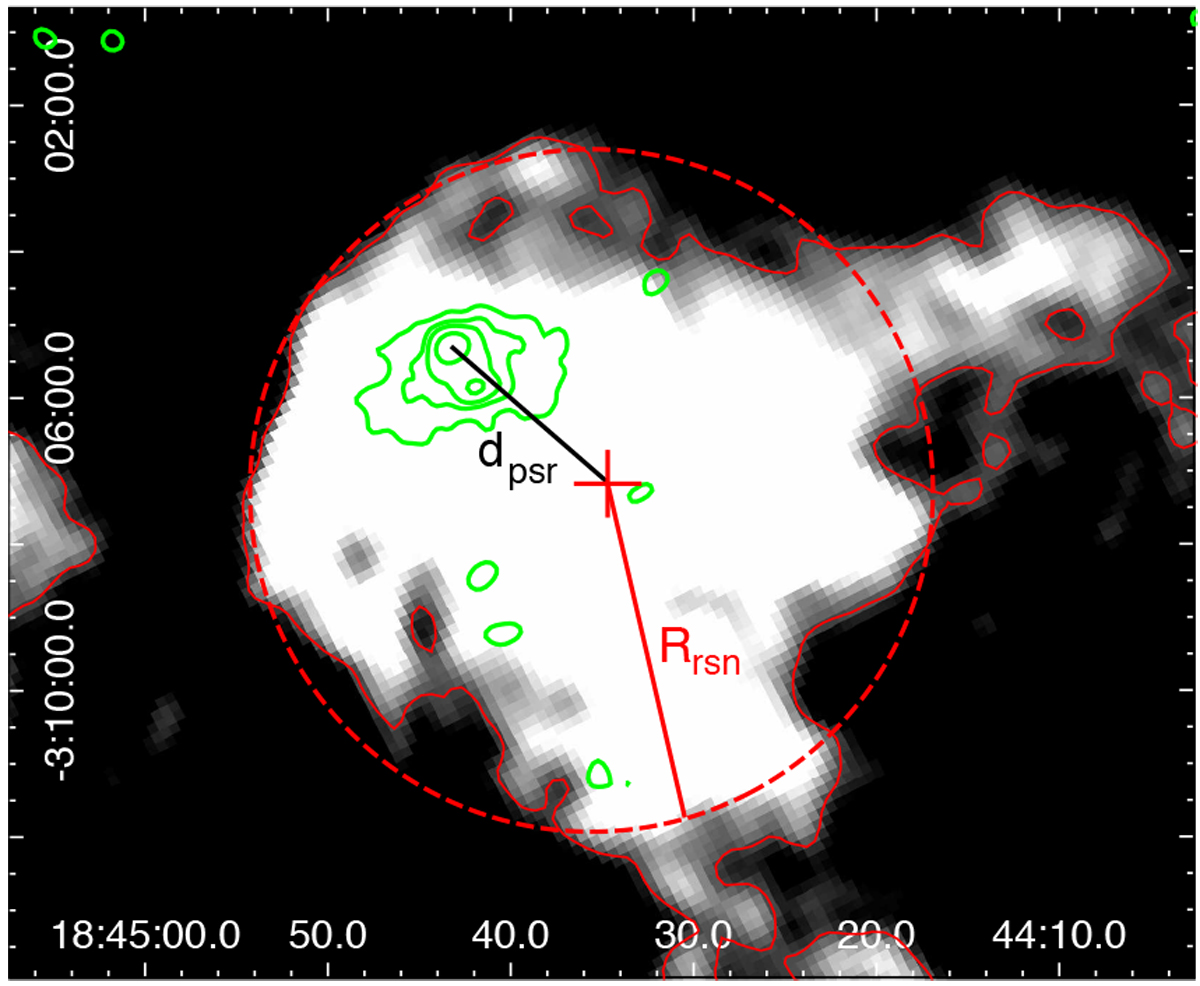
Radio continuum emission at 1.4 GHz toward G29.37+0.1 extracted from the MAGPIS (in gray with red contours). The brightness scale is saturated to show the boundary of the diffuse emission, approximated by the red dotted circle of radius Rsnr. X-ray emission from the PWN G29.4+0.1 is shown with green contours, and dpsr represents the distance between the PS1 and the center of the SNR.
Current usage metrics show cumulative count of Article Views (full-text article views including HTML views, PDF and ePub downloads, according to the available data) and Abstracts Views on Vision4Press platform.
Data correspond to usage on the plateform after 2015. The current usage metrics is available 48-96 hours after online publication and is updated daily on week days.
Initial download of the metrics may take a while.