Fig. 11
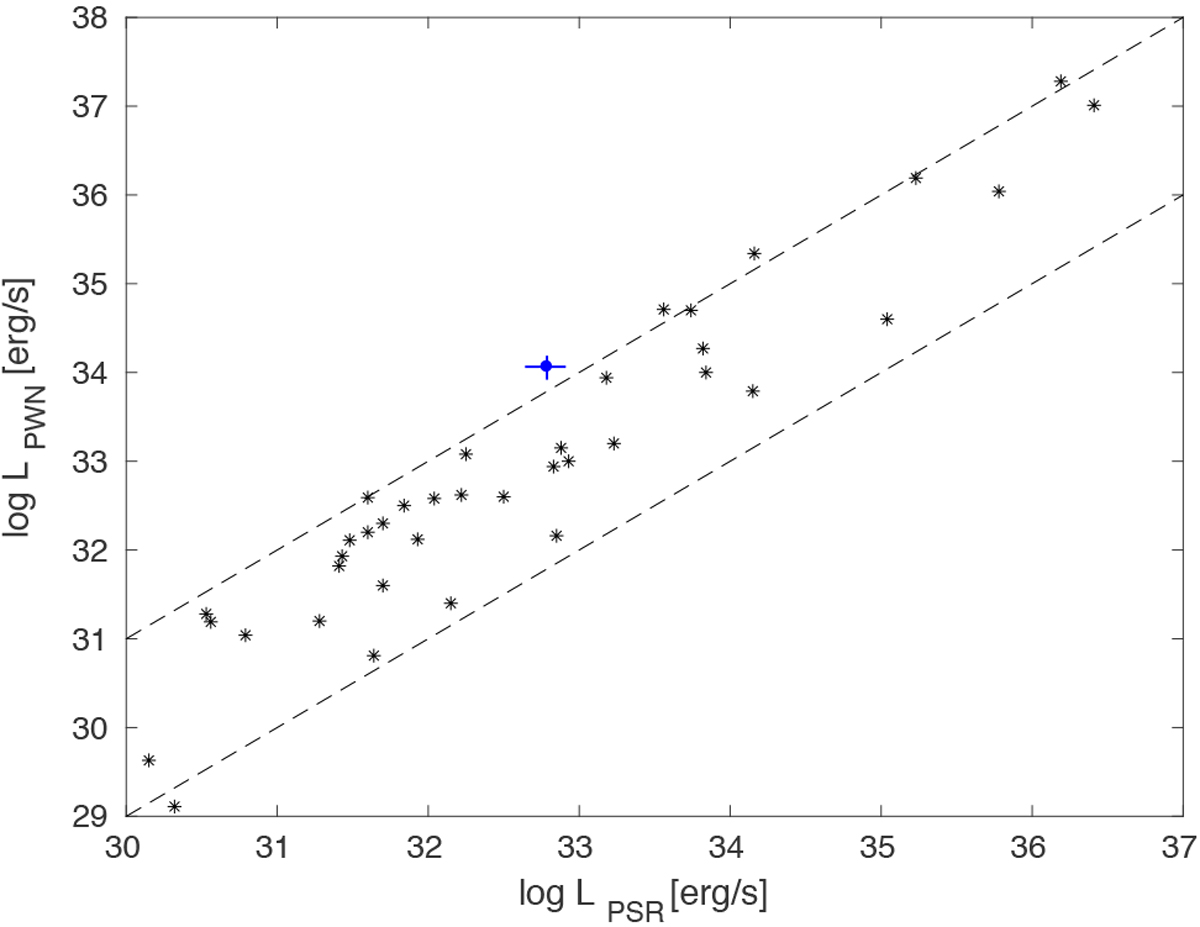
Absorption-corrected luminosities of the extended emission (blue line; the PWN G29.4+0.1) and the point source PS1 (the PSR) in the 0.5–8.0 keV energy band for a distance range between 5.5 and 7.5 kpc. The blue point represents the values for 6.5 kpc. The error bar corresponds to luminosities calculated between 5.5 and 7.5 kpc. The black stars correspond to a population of X-ray PWNe and their powering PSRs, and the dashed lines are upper and lower bounds defined in Kargaltsev & Pavlov (2008).
Current usage metrics show cumulative count of Article Views (full-text article views including HTML views, PDF and ePub downloads, according to the available data) and Abstracts Views on Vision4Press platform.
Data correspond to usage on the plateform after 2015. The current usage metrics is available 48-96 hours after online publication and is updated daily on week days.
Initial download of the metrics may take a while.