Fig. 10
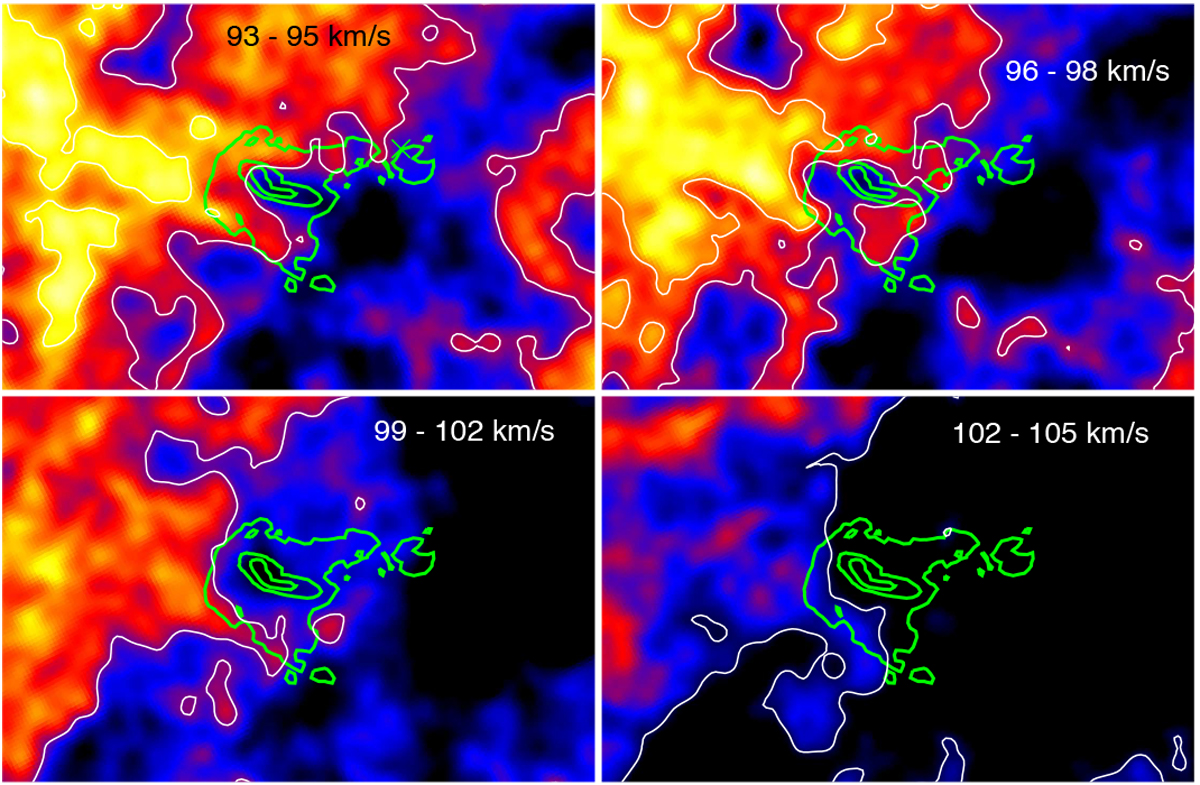
HI channel map between 93 and 105 km s−1. We indicatein each panel the approximate velocity interval over which the emission was summed. Contour levels (in arbitrary units) are 350 and 430 (upper left), 350 and 400 (upper right), 340 (bottom left), and 270 (bottom right). The MAGPIS radio continuum emission at 20 cm from G29.37+0.1 is shown with green contours.
Current usage metrics show cumulative count of Article Views (full-text article views including HTML views, PDF and ePub downloads, according to the available data) and Abstracts Views on Vision4Press platform.
Data correspond to usage on the plateform after 2015. The current usage metrics is available 48-96 hours after online publication and is updated daily on week days.
Initial download of the metrics may take a while.