Free Access
Fig. 5.
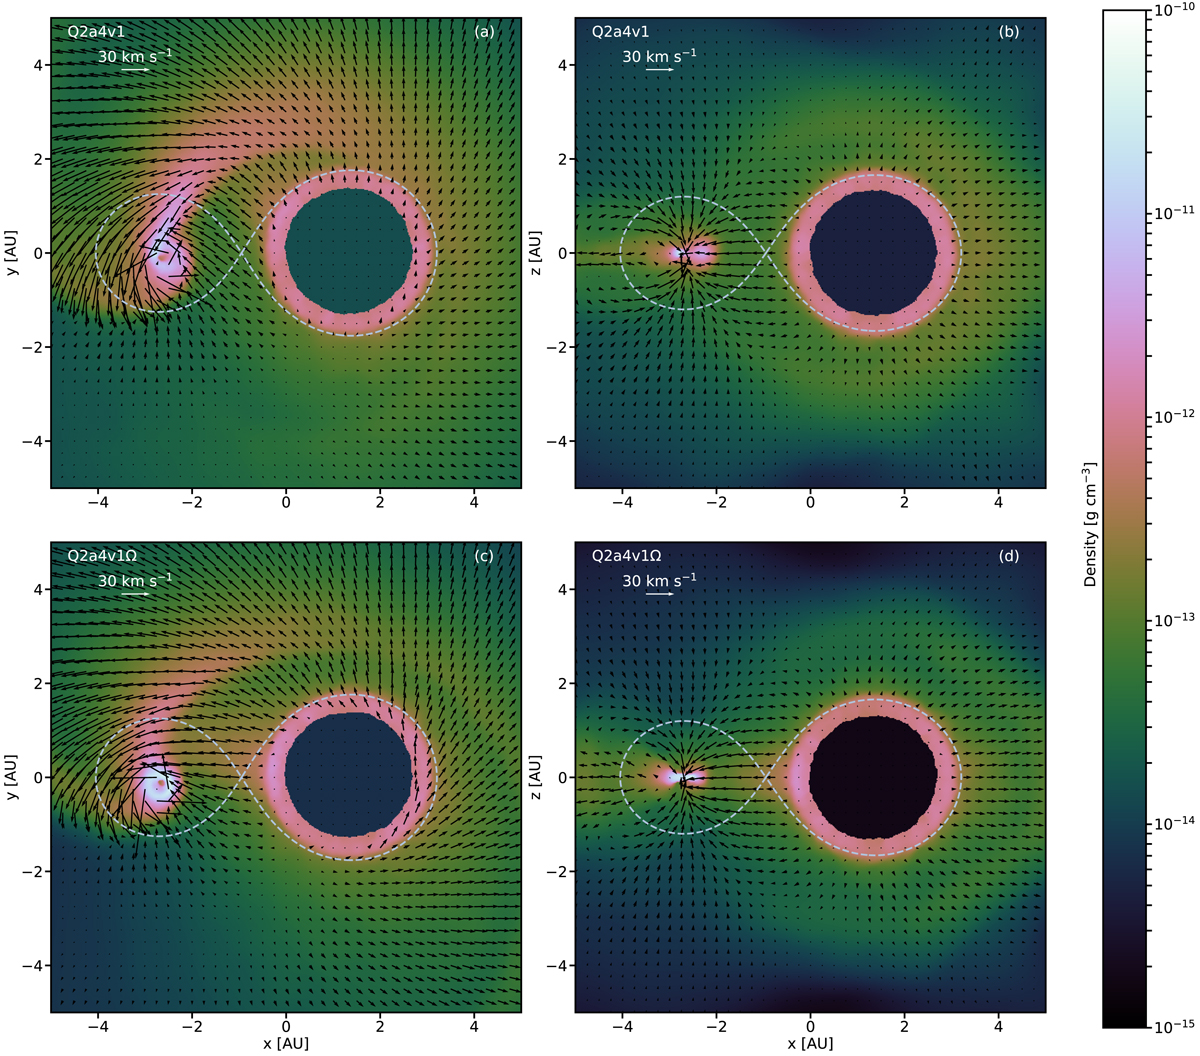
Density of the gas for models Q2a4v1 and Q2a4v1Ω after 9.5 orbital periods. The images on the left show the density and velocity field in the inertial frame in the orbital plane (z = 0). The images on the right show the same quantities, but on the y = 0 plane. The dashed lines correspond to the Roche-lobes of the stars.
Current usage metrics show cumulative count of Article Views (full-text article views including HTML views, PDF and ePub downloads, according to the available data) and Abstracts Views on Vision4Press platform.
Data correspond to usage on the plateform after 2015. The current usage metrics is available 48-96 hours after online publication and is updated daily on week days.
Initial download of the metrics may take a while.